| __timestamp | RB Global, Inc. | Trane Technologies plc |
|---|---|---|
| Wednesday, January 1, 2014 | 178851000 | 1757000000 |
| Thursday, January 1, 2015 | 211417000 | 1835000000 |
| Friday, January 1, 2016 | 174791291 | 2311000000 |
| Sunday, January 1, 2017 | 168379000 | 1982500000 |
| Monday, January 1, 2018 | 263653000 | 2242400000 |
| Tuesday, January 1, 2019 | 322140110 | 1931200000 |
| Wednesday, January 1, 2020 | 358617000 | 1831900000 |
| Friday, January 1, 2021 | 339928424 | 2319200000 |
| Saturday, January 1, 2022 | 557399151 | 2715500000 |
| Sunday, January 1, 2023 | 975874087 | 3149900000 |
| Monday, January 1, 2024 | 761100000 | 3859600000 |
Unleashing the power of data
In the ever-evolving landscape of industrial giants, Trane Technologies plc and RB Global, Inc. have showcased remarkable EBITDA growth over the past decade. From 2014 to 2023, Trane Technologies has consistently outperformed, with its EBITDA soaring by approximately 79%, reaching a peak in 2023. Meanwhile, RB Global has demonstrated a robust growth trajectory, with its EBITDA increasing by an impressive 446% over the same period.
This data underscores the dynamic growth and resilience of these companies, highlighting their strategic prowess in navigating the industrial sector's challenges.
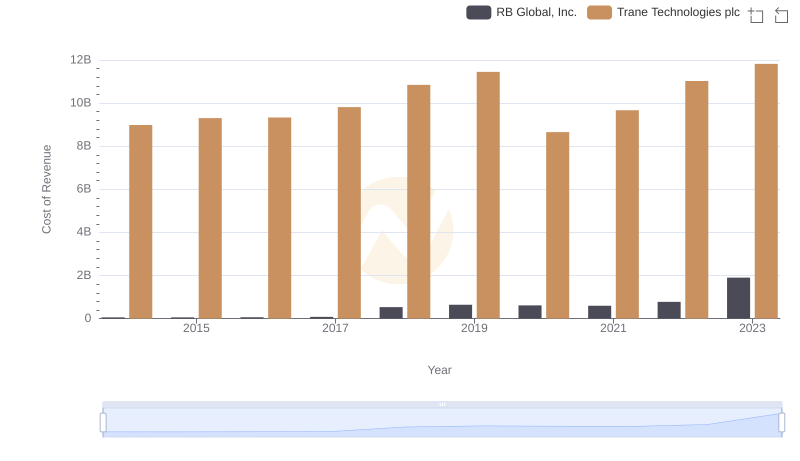
Cost Insights: Breaking Down Trane Technologies plc and RB Global, Inc.'s Expenses
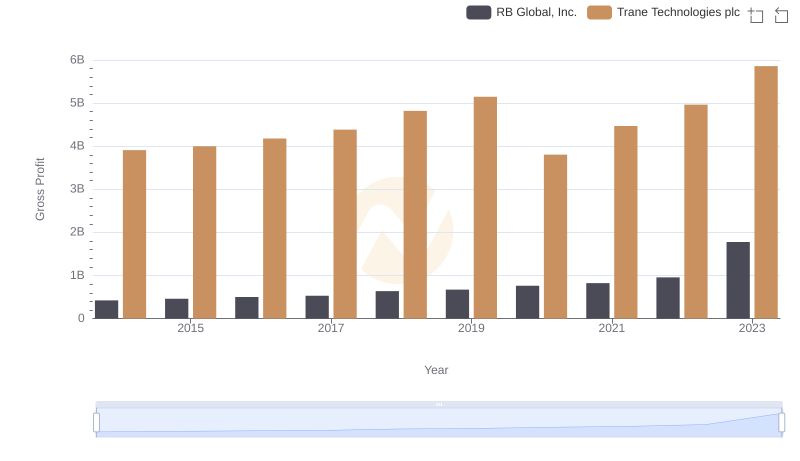
Who Generates Higher Gross Profit? Trane Technologies plc or RB Global, Inc.
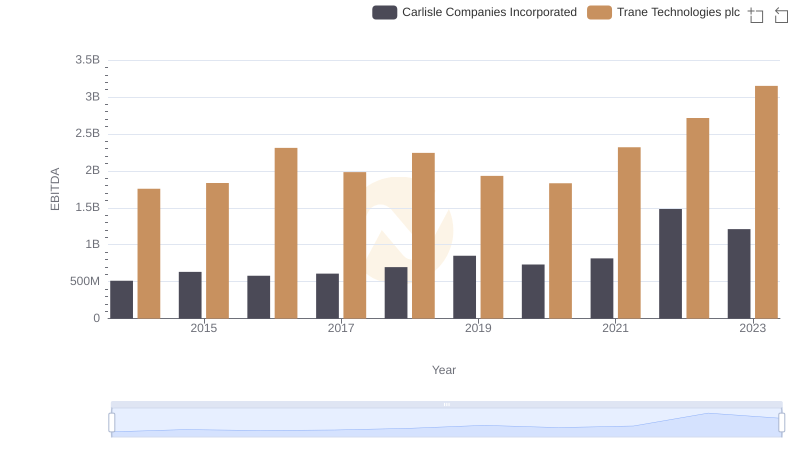
A Professional Review of EBITDA: Trane Technologies plc Compared to Carlisle Companies Incorporated
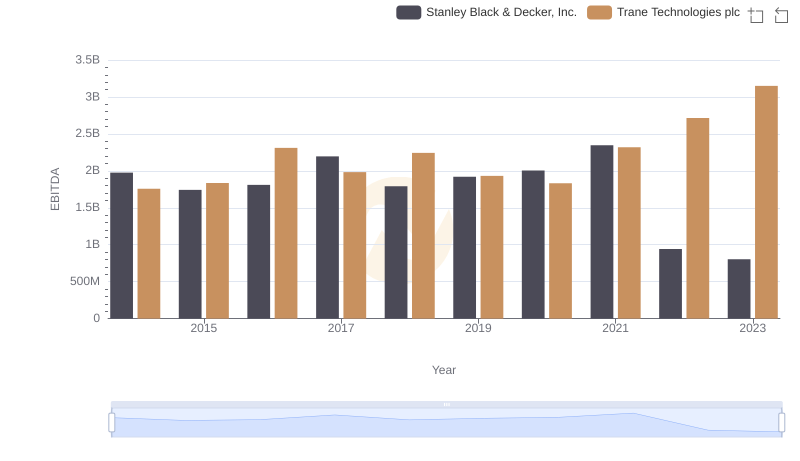
EBITDA Metrics Evaluated: Trane Technologies plc vs Stanley Black & Decker, Inc.

Professional EBITDA Benchmarking: Trane Technologies plc vs Booz Allen Hamilton Holding Corporation
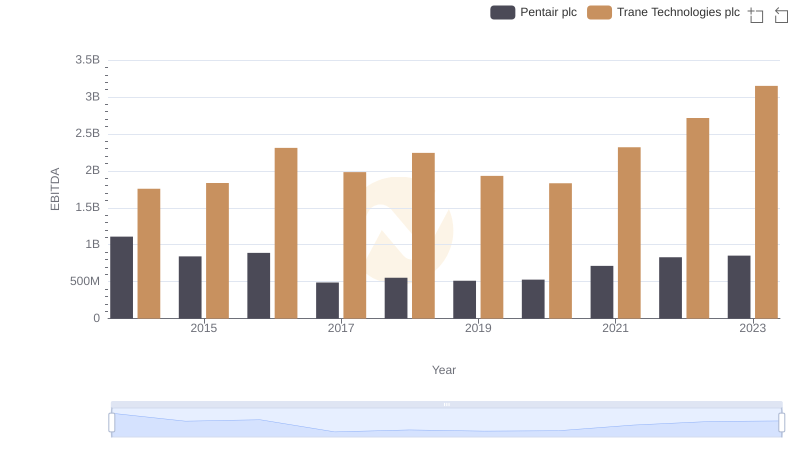
EBITDA Performance Review: Trane Technologies plc vs Pentair plc
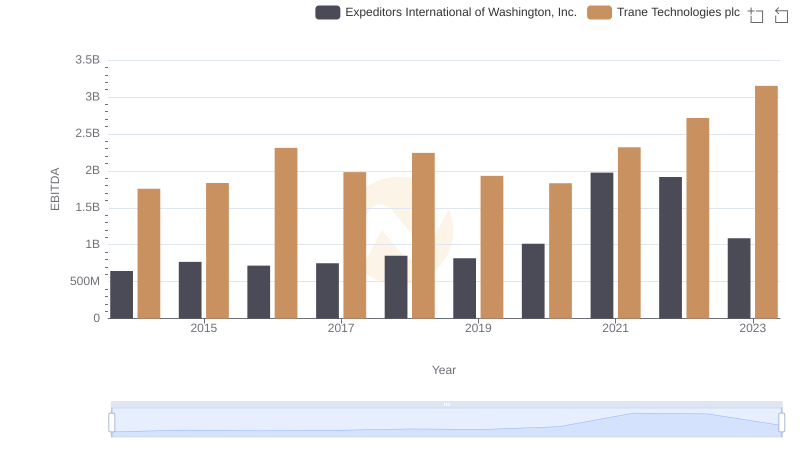
Trane Technologies plc vs Expeditors International of Washington, Inc.: In-Depth EBITDA Performance Comparison
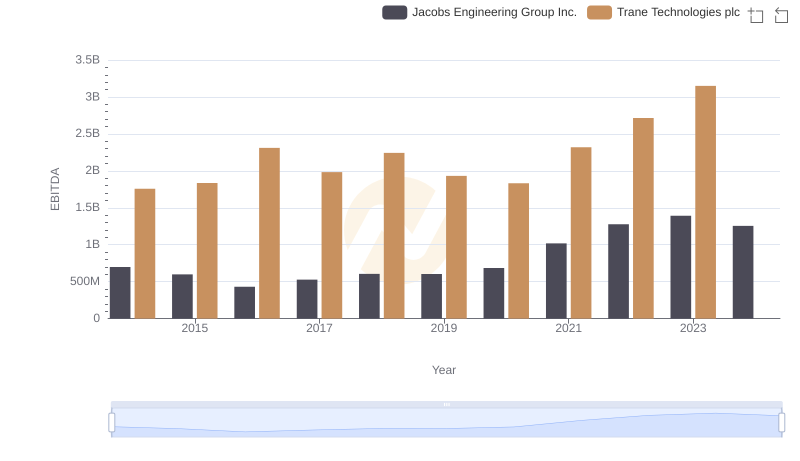
EBITDA Analysis: Evaluating Trane Technologies plc Against Jacobs Engineering Group Inc.
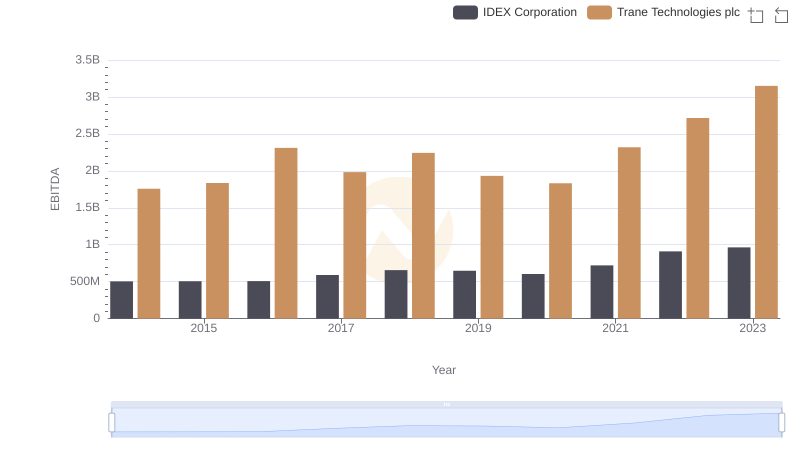
Professional EBITDA Benchmarking: Trane Technologies plc vs IDEX Corporation