| __timestamp | Parker-Hannifin Corporation | RB Global, Inc. |
|---|---|---|
| Wednesday, January 1, 2014 | 3027744000 | 423213000 |
| Thursday, January 1, 2015 | 3056499000 | 459849000 |
| Friday, January 1, 2016 | 2537369000 | 500333000 |
| Sunday, January 1, 2017 | 2840350000 | 531504000 |
| Monday, January 1, 2018 | 3539551000 | 636629000 |
| Tuesday, January 1, 2019 | 3616840000 | 672825000 |
| Wednesday, January 1, 2020 | 3409002000 | 761671000 |
| Friday, January 1, 2021 | 3897960000 | 822188000 |
| Saturday, January 1, 2022 | 4474341000 | 957107000 |
| Sunday, January 1, 2023 | 6429302000 | 1778400000 |
| Monday, January 1, 2024 | 7127790000 | 4284200000 |
Unlocking the unknown
In the competitive landscape of industrial manufacturing, Parker-Hannifin Corporation and RB Global, Inc. have been pivotal players. Over the past decade, Parker-Hannifin has consistently outperformed RB Global in terms of gross profit. From 2014 to 2023, Parker-Hannifin's gross profit surged by over 135%, peaking at an impressive $7.1 billion in 2023. In contrast, RB Global's growth, while steady, was more modest, with a peak gross profit of $1.8 billion in 2023.
This analysis underscores Parker-Hannifin's strategic prowess in maximizing profitability.
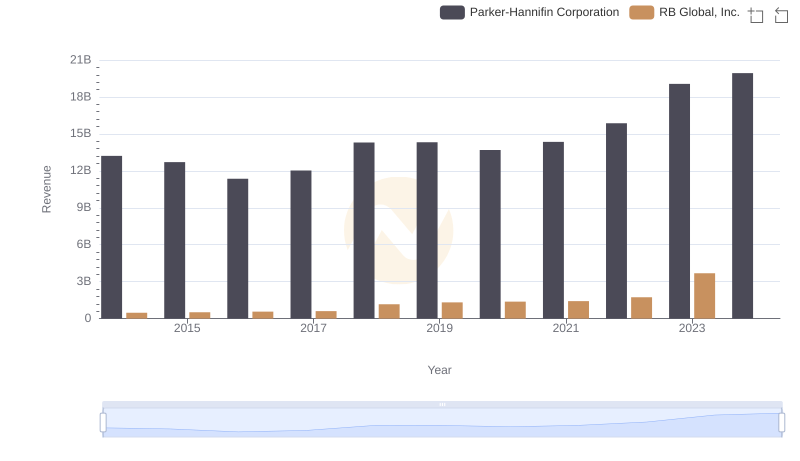
Breaking Down Revenue Trends: Parker-Hannifin Corporation vs RB Global, Inc.
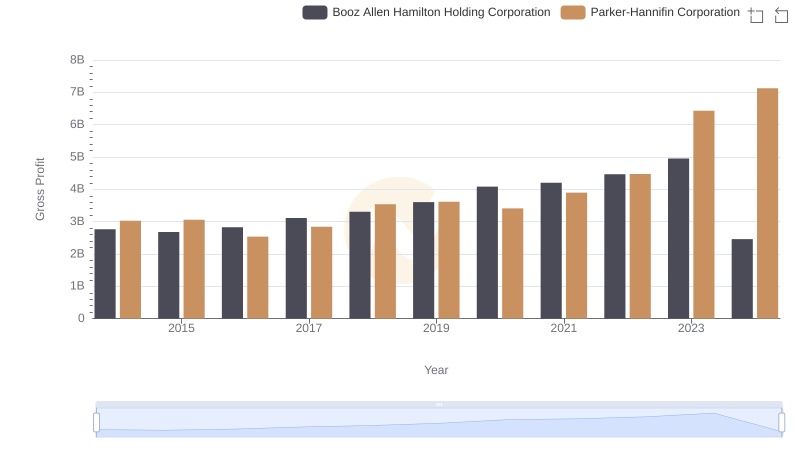
Key Insights on Gross Profit: Parker-Hannifin Corporation vs Booz Allen Hamilton Holding Corporation
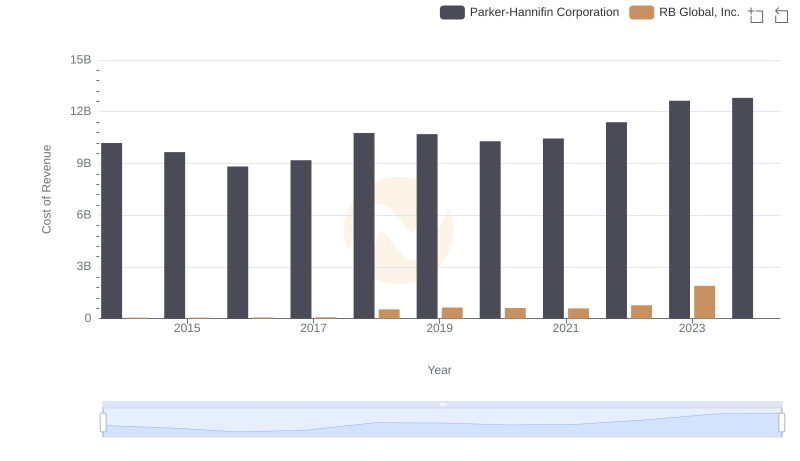
Cost Insights: Breaking Down Parker-Hannifin Corporation and RB Global, Inc.'s Expenses
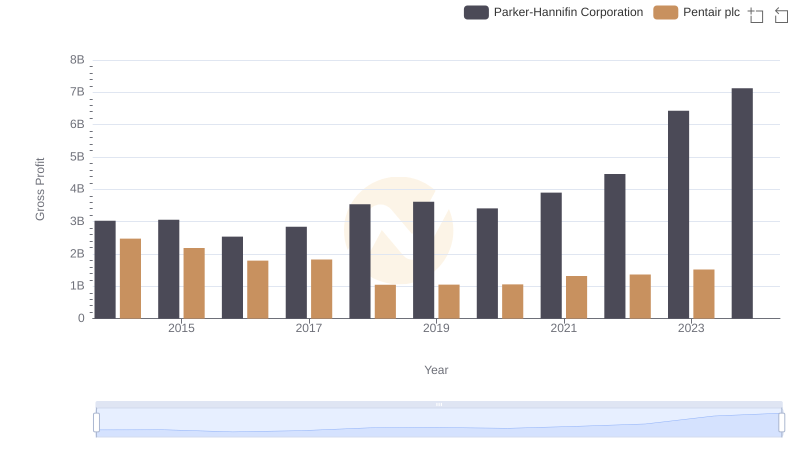
Parker-Hannifin Corporation vs Pentair plc: A Gross Profit Performance Breakdown
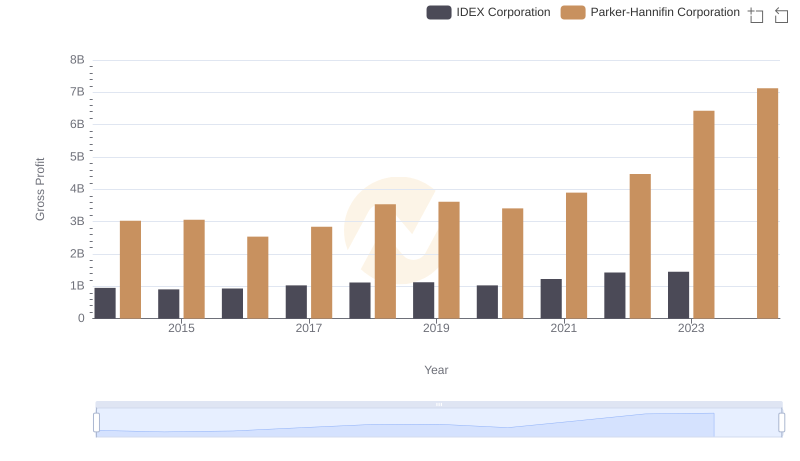
Gross Profit Analysis: Comparing Parker-Hannifin Corporation and IDEX Corporation
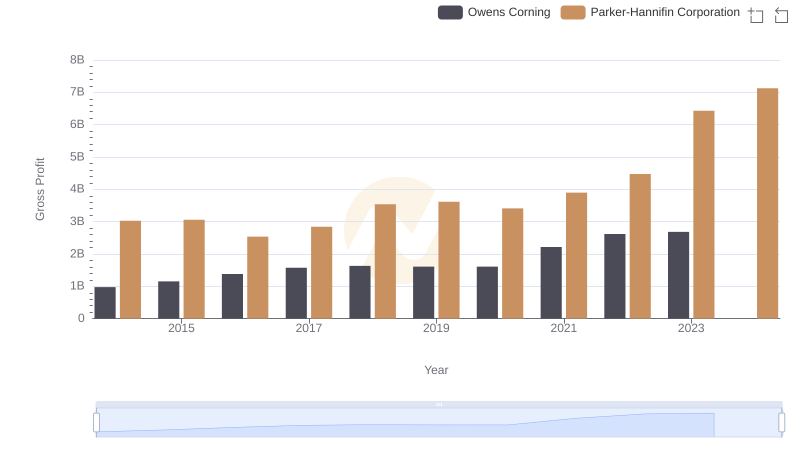
Gross Profit Trends Compared: Parker-Hannifin Corporation vs Owens Corning
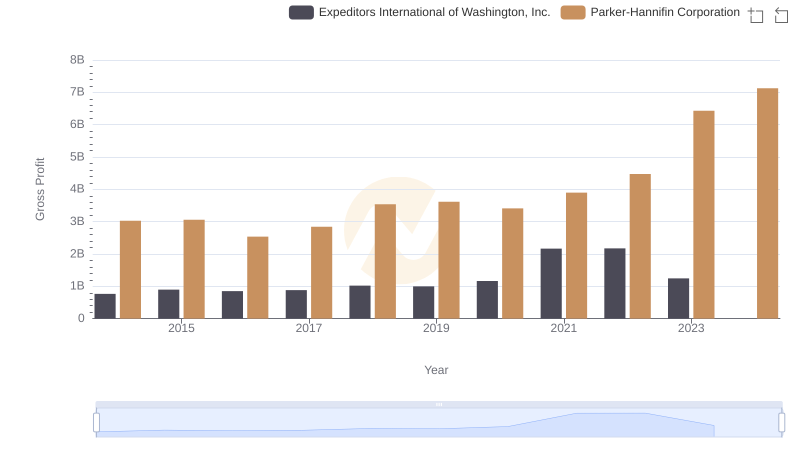
Gross Profit Trends Compared: Parker-Hannifin Corporation vs Expeditors International of Washington, Inc.
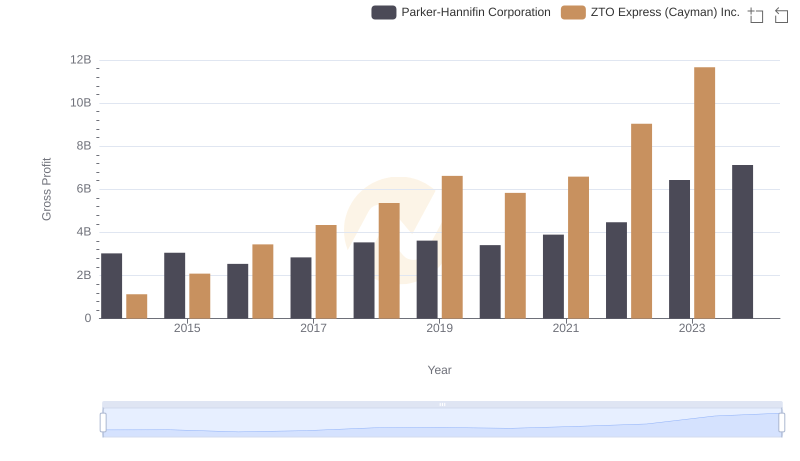
Who Generates Higher Gross Profit? Parker-Hannifin Corporation or ZTO Express (Cayman) Inc.
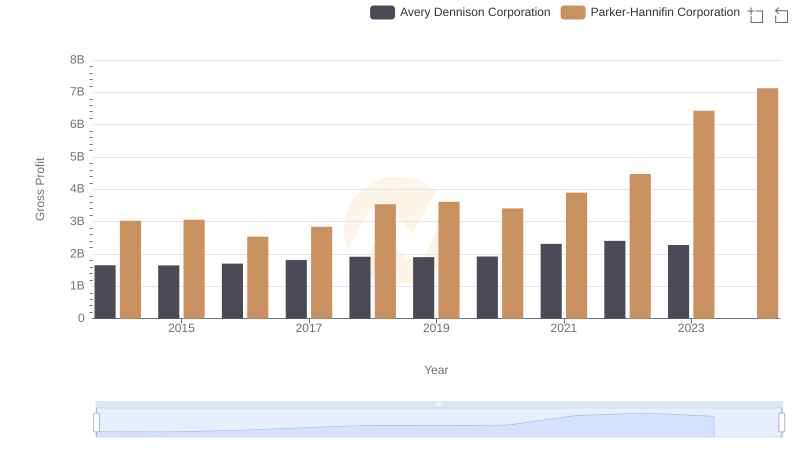
Gross Profit Comparison: Parker-Hannifin Corporation and Avery Dennison Corporation Trends
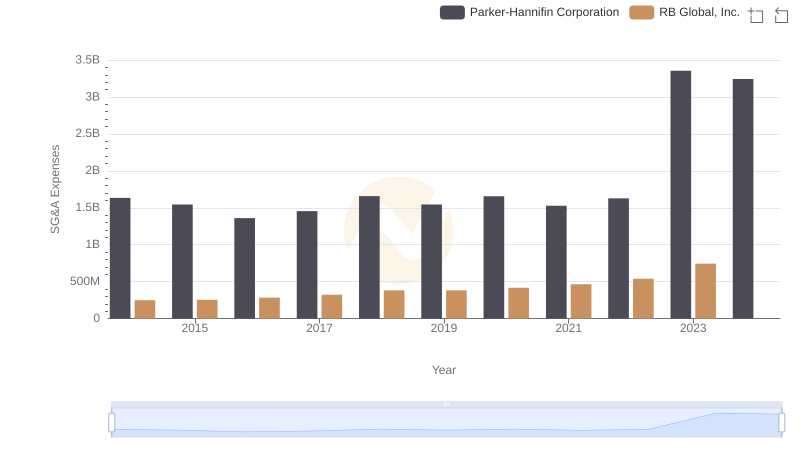
Breaking Down SG&A Expenses: Parker-Hannifin Corporation vs RB Global, Inc.