| __timestamp | Booz Allen Hamilton Holding Corporation | Parker-Hannifin Corporation |
|---|---|---|
| Wednesday, January 1, 2014 | 2762580000 | 3027744000 |
| Thursday, January 1, 2015 | 2680921000 | 3056499000 |
| Friday, January 1, 2016 | 2825712000 | 2537369000 |
| Sunday, January 1, 2017 | 3112302000 | 2840350000 |
| Monday, January 1, 2018 | 3304750000 | 3539551000 |
| Tuesday, January 1, 2019 | 3603571000 | 3616840000 |
| Wednesday, January 1, 2020 | 4084661000 | 3409002000 |
| Friday, January 1, 2021 | 4201408000 | 3897960000 |
| Saturday, January 1, 2022 | 4464078000 | 4474341000 |
| Sunday, January 1, 2023 | 4954101000 | 6429302000 |
| Monday, January 1, 2024 | 2459049000 | 7127790000 |
Data in motion
In the competitive landscape of industrial and consulting sectors, Parker-Hannifin Corporation and Booz Allen Hamilton Holding Corporation have showcased intriguing financial trajectories over the past decade. From 2014 to 2023, Parker-Hannifin's gross profit surged by approximately 112%, peaking at an impressive $6.43 billion in 2023. In contrast, Booz Allen Hamilton experienced a steady growth of around 79%, reaching $4.95 billion in the same year. However, 2024 presents a twist, with Booz Allen's gross profit dropping significantly, while Parker-Hannifin continues its upward trend, hitting a remarkable $7.13 billion. This divergence highlights the resilience and strategic prowess of Parker-Hannifin in navigating market challenges. As we delve into these financial narratives, the data underscores the dynamic nature of corporate growth and the importance of strategic adaptability in sustaining profitability.
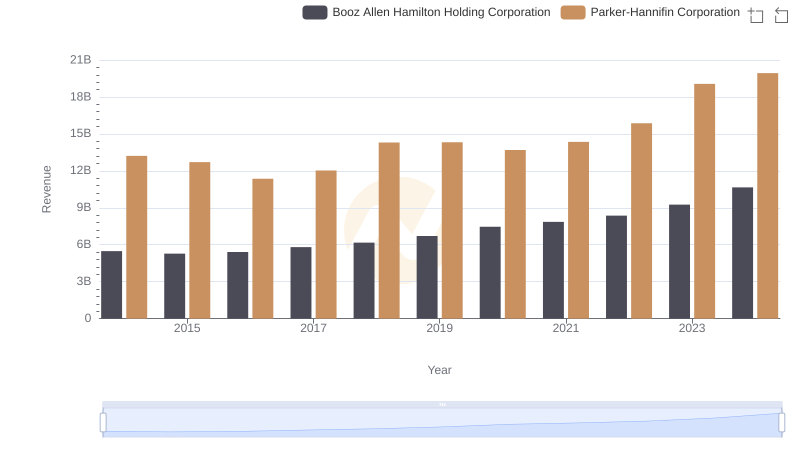
Revenue Showdown: Parker-Hannifin Corporation vs Booz Allen Hamilton Holding Corporation
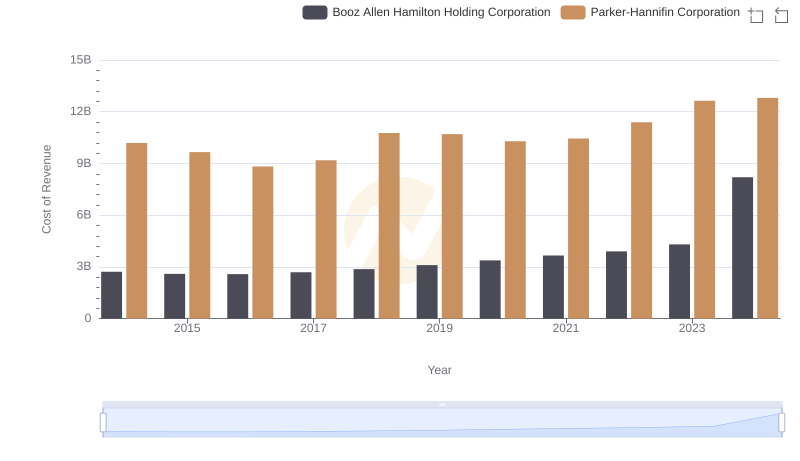
Cost Insights: Breaking Down Parker-Hannifin Corporation and Booz Allen Hamilton Holding Corporation's Expenses
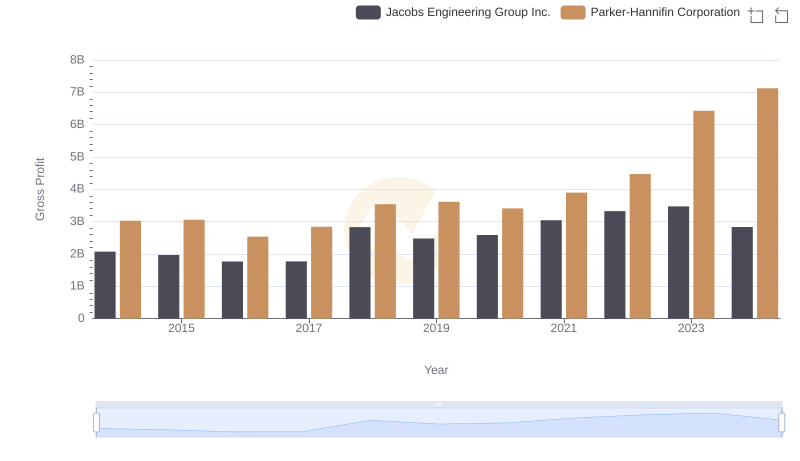
Key Insights on Gross Profit: Parker-Hannifin Corporation vs Jacobs Engineering Group Inc.
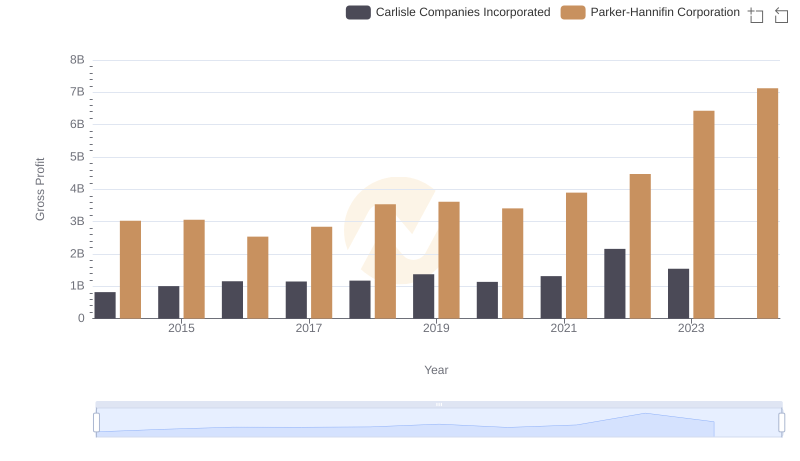
Gross Profit Trends Compared: Parker-Hannifin Corporation vs Carlisle Companies Incorporated
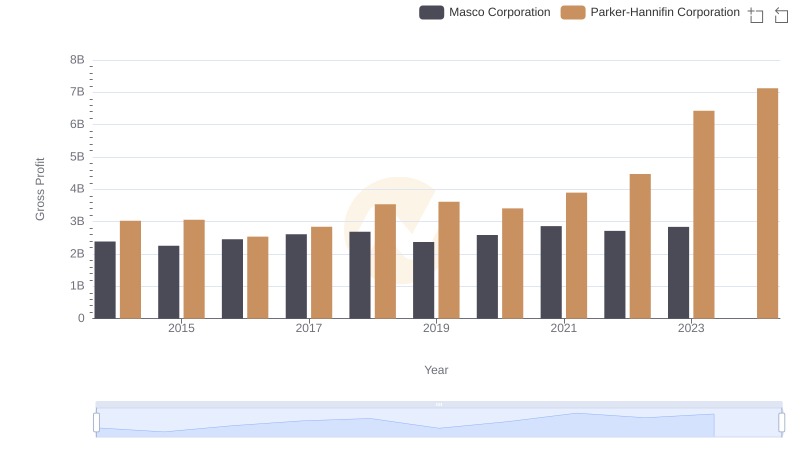
Who Generates Higher Gross Profit? Parker-Hannifin Corporation or Masco Corporation
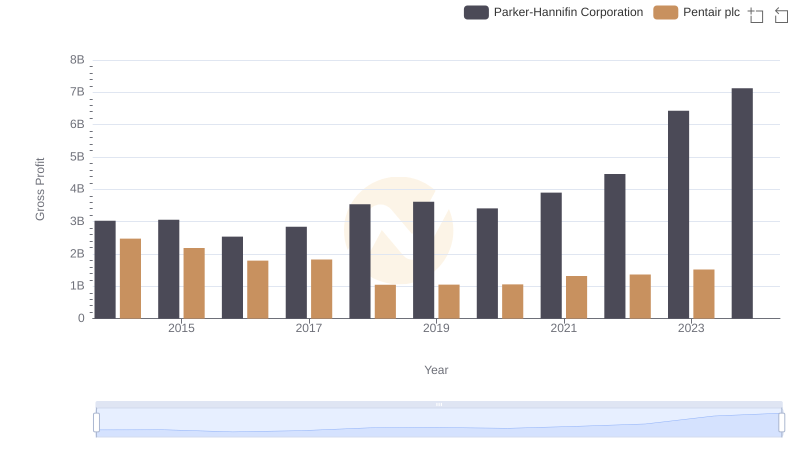
Parker-Hannifin Corporation vs Pentair plc: A Gross Profit Performance Breakdown
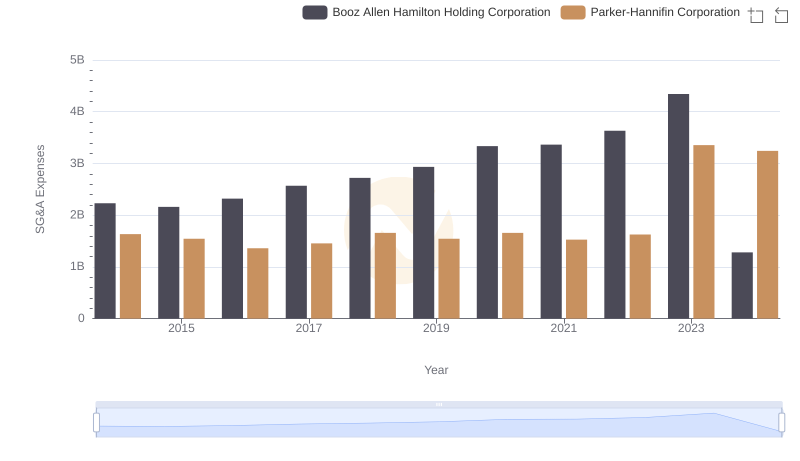
Breaking Down SG&A Expenses: Parker-Hannifin Corporation vs Booz Allen Hamilton Holding Corporation
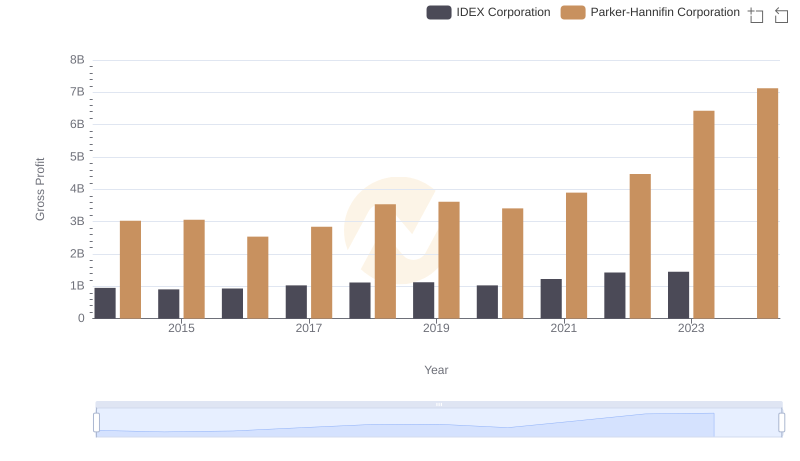
Gross Profit Analysis: Comparing Parker-Hannifin Corporation and IDEX Corporation
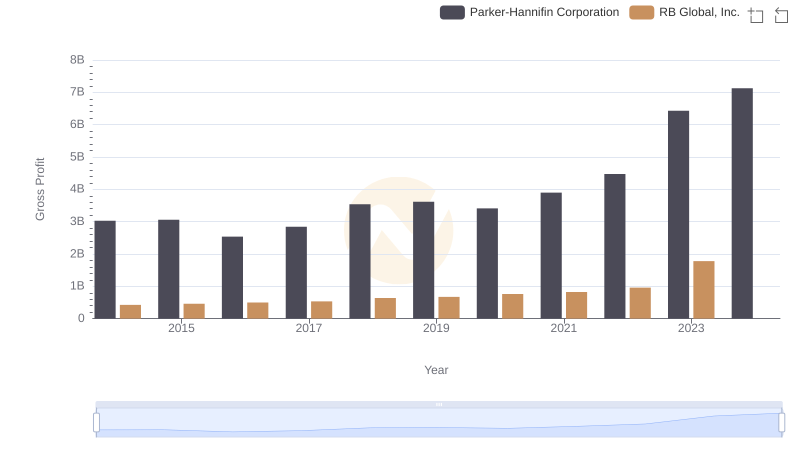
Who Generates Higher Gross Profit? Parker-Hannifin Corporation or RB Global, Inc.