| __timestamp | Avery Dennison Corporation | Parker-Hannifin Corporation |
|---|---|---|
| Wednesday, January 1, 2014 | 1651200000 | 3027744000 |
| Thursday, January 1, 2015 | 1645800000 | 3056499000 |
| Friday, January 1, 2016 | 1699700000 | 2537369000 |
| Sunday, January 1, 2017 | 1812200000 | 2840350000 |
| Monday, January 1, 2018 | 1915500000 | 3539551000 |
| Tuesday, January 1, 2019 | 1904100000 | 3616840000 |
| Wednesday, January 1, 2020 | 1923300000 | 3409002000 |
| Friday, January 1, 2021 | 2312800000 | 3897960000 |
| Saturday, January 1, 2022 | 2404200000 | 4474341000 |
| Sunday, January 1, 2023 | 2277499999 | 6429302000 |
| Monday, January 1, 2024 | 2530700000 | 7127790000 |
Cracking the code
In the competitive landscape of industrial manufacturing and labeling solutions, Parker-Hannifin Corporation and Avery Dennison Corporation have showcased intriguing financial trajectories over the past decade. From 2014 to 2023, Parker-Hannifin's gross profit surged by approximately 112%, reflecting its robust growth strategy and market adaptability. In contrast, Avery Dennison experienced a more modest increase of around 38%, highlighting its steady yet consistent performance in the labeling industry.
Parker-Hannifin's gross profit leap in 2023, reaching over 6.4 billion, underscores its strategic expansions and acquisitions. Meanwhile, Avery Dennison's peak in 2022, with a gross profit of 2.4 billion, marks its resilience amidst market fluctuations. Notably, the data for Avery Dennison in 2024 is missing, leaving room for speculation on its future trajectory. This comparison not only highlights the dynamic nature of these corporations but also offers insights into their strategic directions.
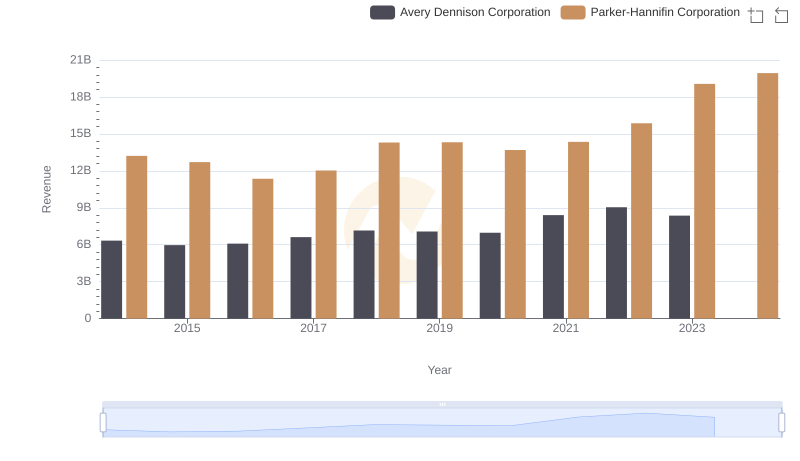
Comparing Revenue Performance: Parker-Hannifin Corporation or Avery Dennison Corporation?
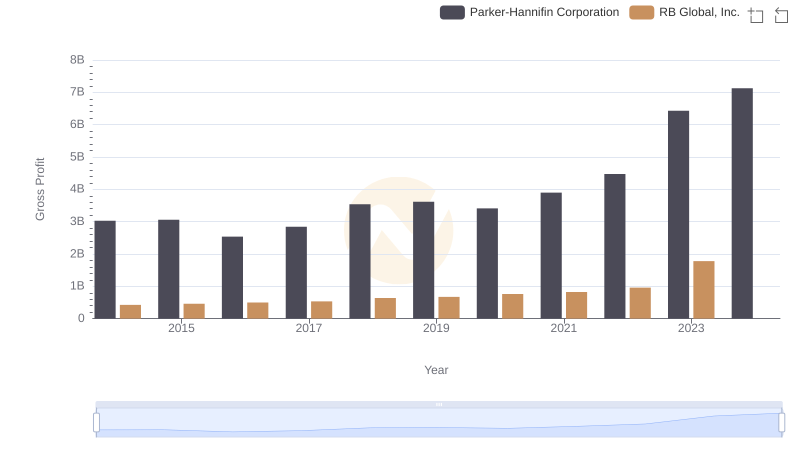
Who Generates Higher Gross Profit? Parker-Hannifin Corporation or RB Global, Inc.
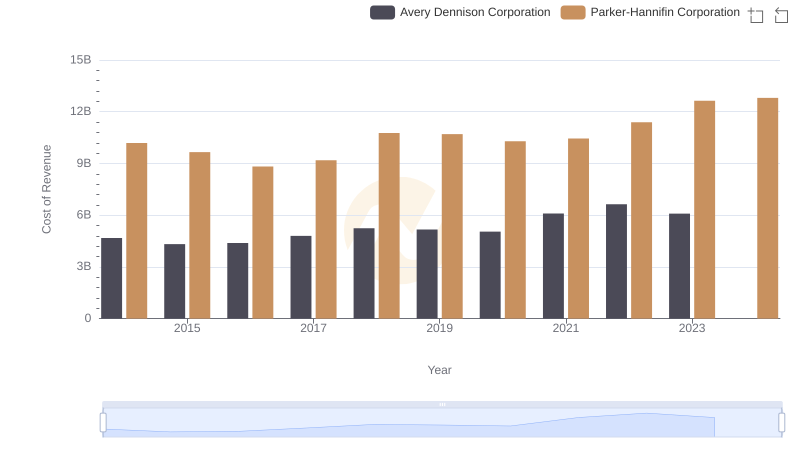
Cost of Revenue Trends: Parker-Hannifin Corporation vs Avery Dennison Corporation
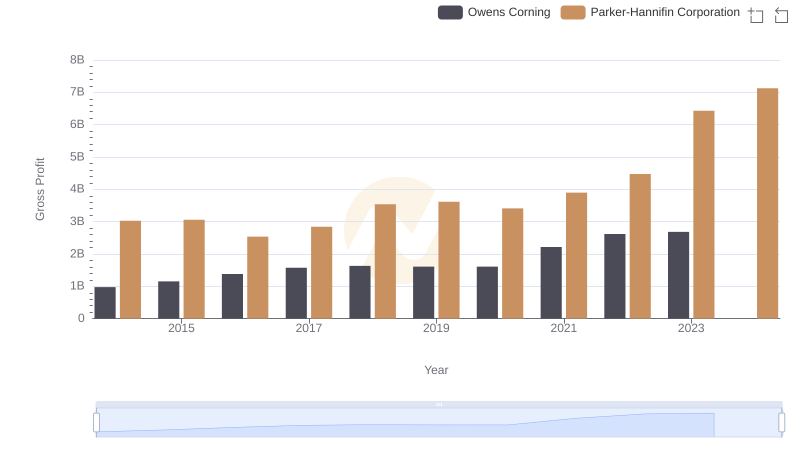
Gross Profit Trends Compared: Parker-Hannifin Corporation vs Owens Corning
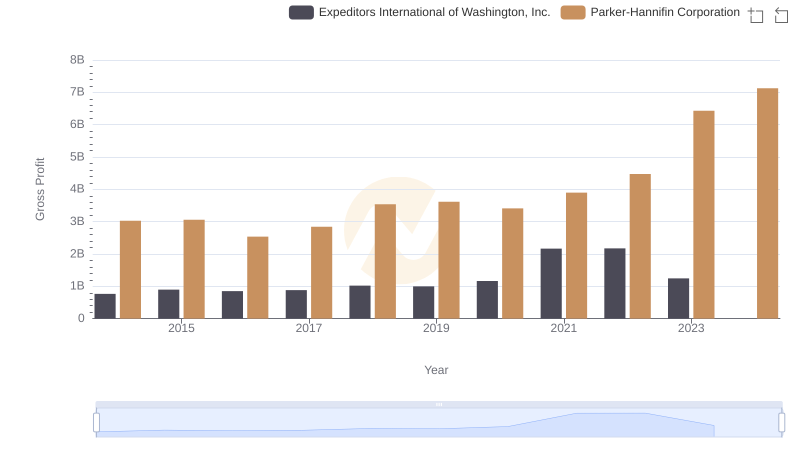
Gross Profit Trends Compared: Parker-Hannifin Corporation vs Expeditors International of Washington, Inc.
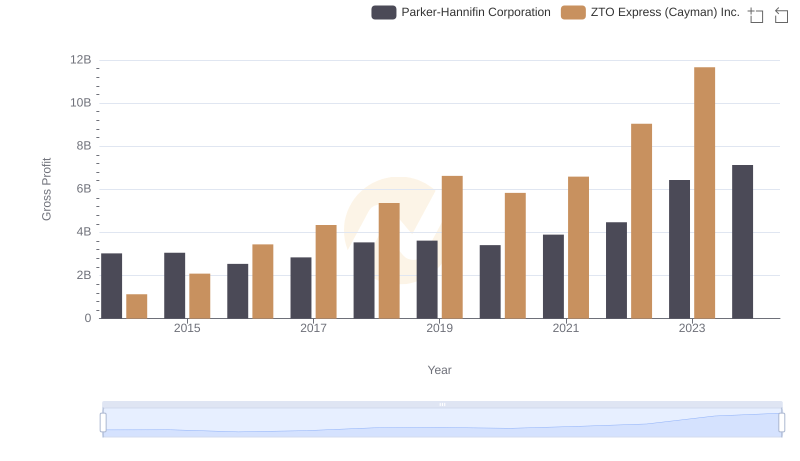
Who Generates Higher Gross Profit? Parker-Hannifin Corporation or ZTO Express (Cayman) Inc.
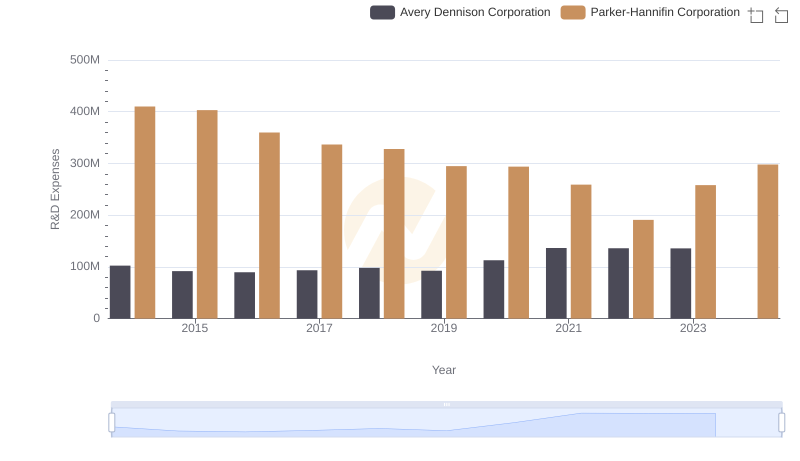
Analyzing R&D Budgets: Parker-Hannifin Corporation vs Avery Dennison Corporation
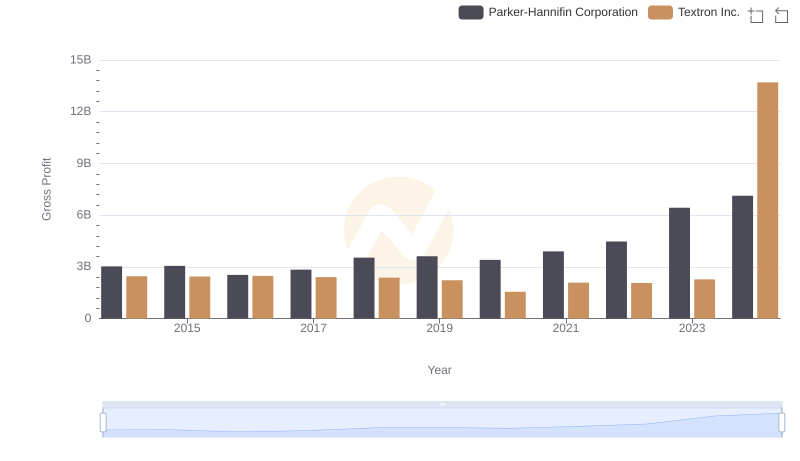
Who Generates Higher Gross Profit? Parker-Hannifin Corporation or Textron Inc.
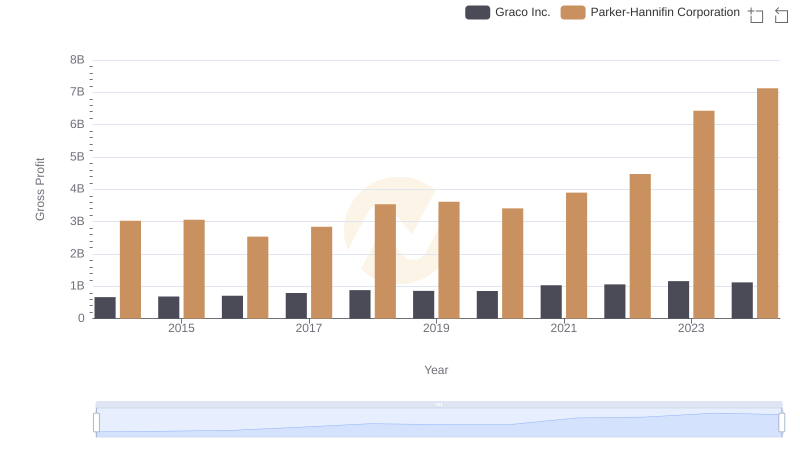
Gross Profit Analysis: Comparing Parker-Hannifin Corporation and Graco Inc.
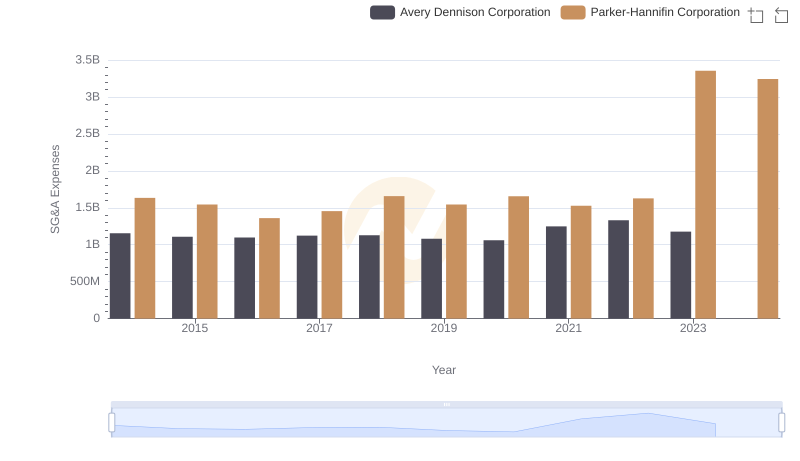
Parker-Hannifin Corporation and Avery Dennison Corporation: SG&A Spending Patterns Compared
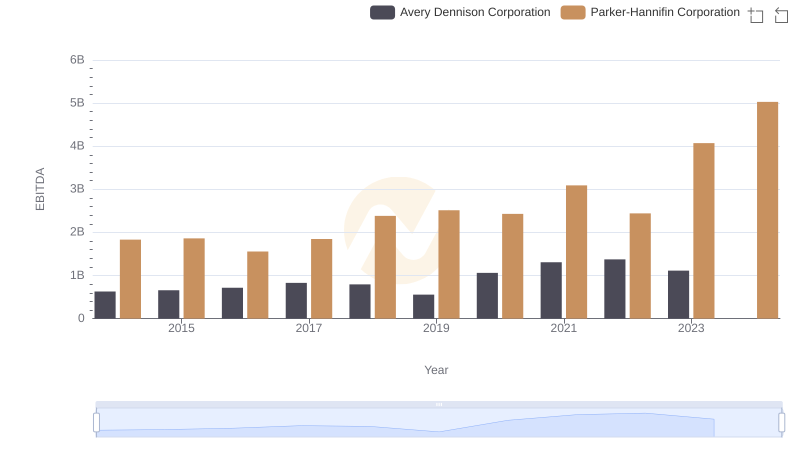
EBITDA Metrics Evaluated: Parker-Hannifin Corporation vs Avery Dennison Corporation