| __timestamp | Parker-Hannifin Corporation | RB Global, Inc. |
|---|---|---|
| Wednesday, January 1, 2014 | 13215971000 | 481097000 |
| Thursday, January 1, 2015 | 12711744000 | 515875000 |
| Friday, January 1, 2016 | 11360753000 | 566395000 |
| Sunday, January 1, 2017 | 12029312000 | 610517000 |
| Monday, January 1, 2018 | 14302392000 | 1170026000 |
| Tuesday, January 1, 2019 | 14320324000 | 1318641000 |
| Wednesday, January 1, 2020 | 13695520000 | 1377260000 |
| Friday, January 1, 2021 | 14347640000 | 1416971000 |
| Saturday, January 1, 2022 | 15861608000 | 1733808000 |
| Sunday, January 1, 2023 | 19065194000 | 3679600000 |
| Monday, January 1, 2024 | 19929606000 | 4284200000 |
Infusing magic into the data realm
In the competitive landscape of industrial and auction services, Parker-Hannifin Corporation and RB Global, Inc. have showcased distinct revenue trajectories over the past decade. Parker-Hannifin, a leader in motion and control technologies, has seen its revenue grow by approximately 51% from 2014 to 2023, peaking at nearly $20 billion in 2023. This growth underscores its robust market position and strategic expansions. In contrast, RB Global, Inc., a major player in the auction industry, experienced a remarkable 665% increase in revenue over the same period, reaching $3.68 billion in 2023. This surge highlights its successful adaptation to market demands and digital transformation. However, data for 2024 remains incomplete, leaving room for speculation on future trends. As these companies continue to evolve, their revenue patterns offer valuable insights into their strategic directions and market dynamics.
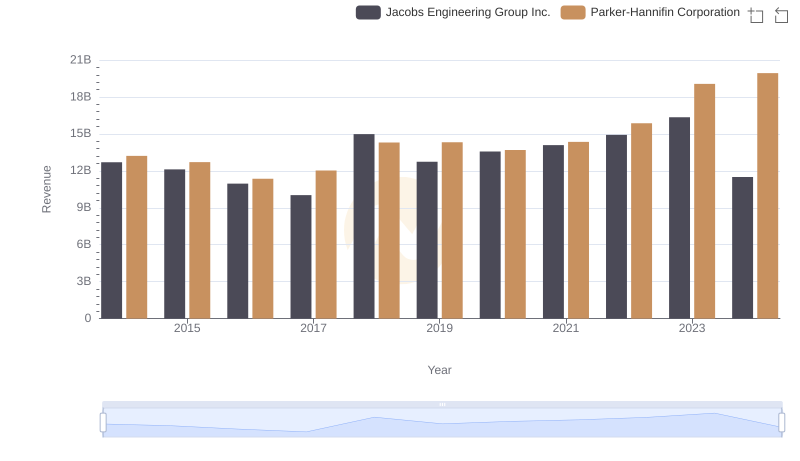
Parker-Hannifin Corporation or Jacobs Engineering Group Inc.: Who Leads in Yearly Revenue?
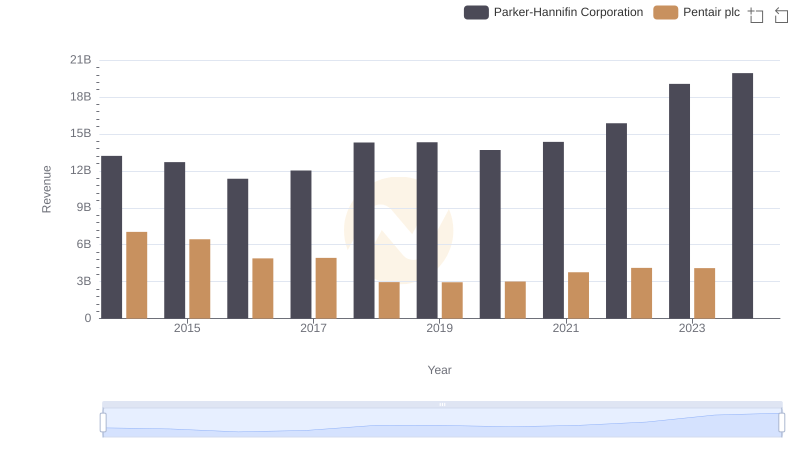
Annual Revenue Comparison: Parker-Hannifin Corporation vs Pentair plc
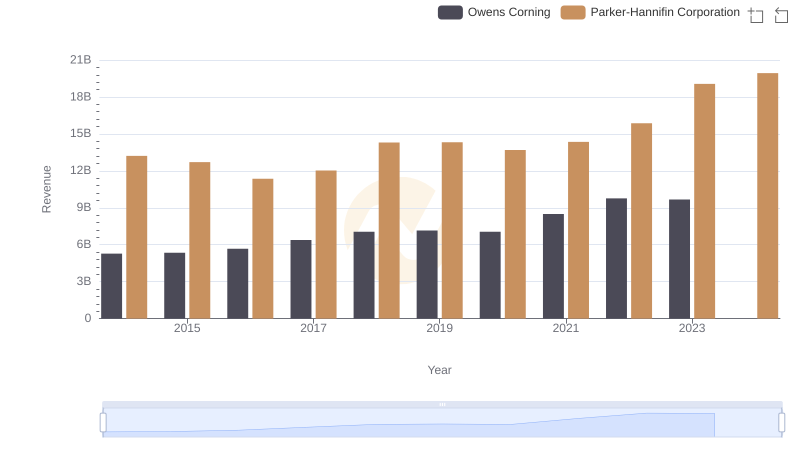
Comparing Revenue Performance: Parker-Hannifin Corporation or Owens Corning?

Revenue Insights: Parker-Hannifin Corporation and Expeditors International of Washington, Inc. Performance Compared

Parker-Hannifin Corporation or China Eastern Airlines Corporation Limited: Who Leads in Yearly Revenue?

Parker-Hannifin Corporation and XPO Logistics, Inc.: A Comprehensive Revenue Analysis
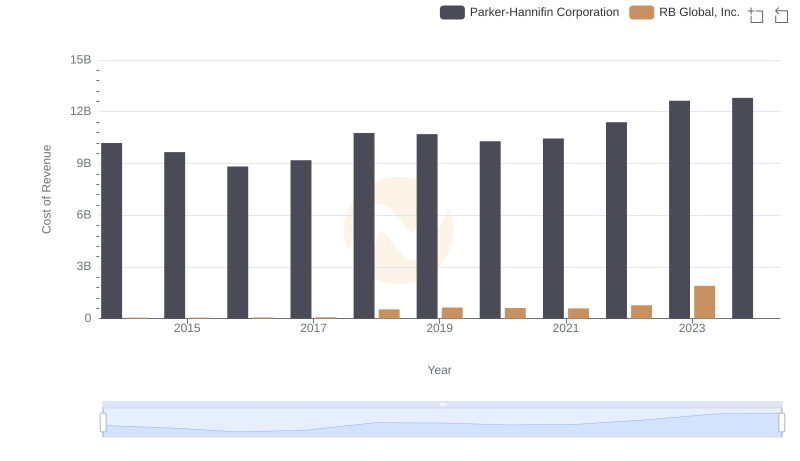
Cost Insights: Breaking Down Parker-Hannifin Corporation and RB Global, Inc.'s Expenses
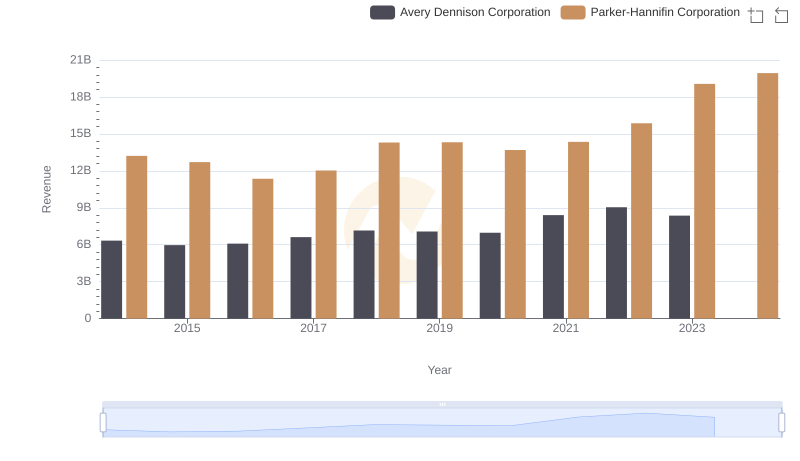
Comparing Revenue Performance: Parker-Hannifin Corporation or Avery Dennison Corporation?
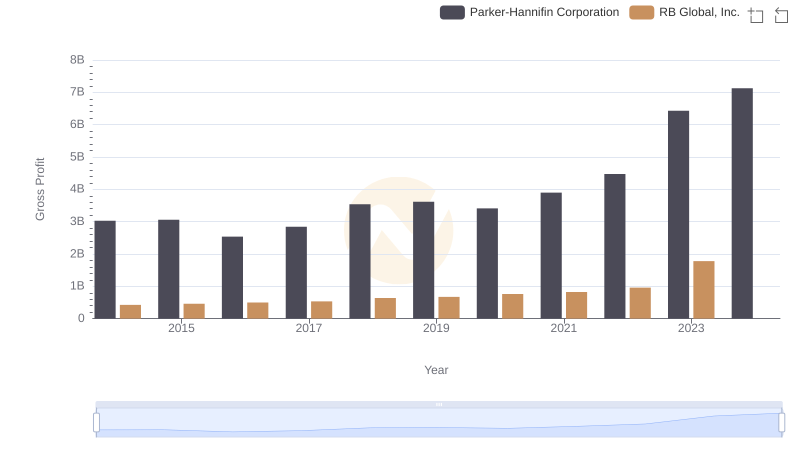
Who Generates Higher Gross Profit? Parker-Hannifin Corporation or RB Global, Inc.
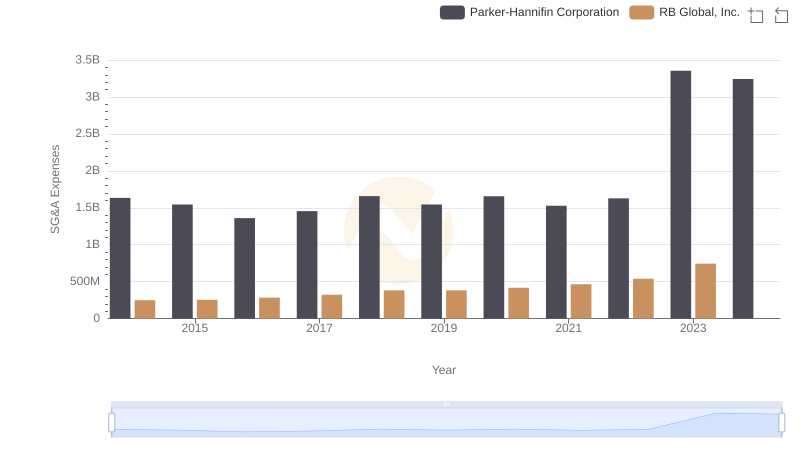
Breaking Down SG&A Expenses: Parker-Hannifin Corporation vs RB Global, Inc.