| __timestamp | Expeditors International of Washington, Inc. | Parker-Hannifin Corporation |
|---|---|---|
| Wednesday, January 1, 2014 | 763996000 | 3027744000 |
| Thursday, January 1, 2015 | 895784000 | 3056499000 |
| Friday, January 1, 2016 | 850793000 | 2537369000 |
| Sunday, January 1, 2017 | 883027000 | 2840350000 |
| Monday, January 1, 2018 | 1020282000 | 3539551000 |
| Tuesday, January 1, 2019 | 997021000 | 3616840000 |
| Wednesday, January 1, 2020 | 1162765000 | 3409002000 |
| Friday, January 1, 2021 | 2165412000 | 3897960000 |
| Saturday, January 1, 2022 | 2171130000 | 4474341000 |
| Sunday, January 1, 2023 | 1245476000 | 6429302000 |
| Monday, January 1, 2024 | 10600515000 | 7127790000 |
Data in motion
In the competitive landscape of industrial and logistics sectors, Parker-Hannifin Corporation and Expeditors International of Washington, Inc. have showcased intriguing gross profit trends over the past decade. From 2014 to 2023, Parker-Hannifin's gross profit surged by approximately 112%, peaking in 2023 with a remarkable 6.43 billion. Meanwhile, Expeditors International experienced a more modest growth of around 63%, reaching its zenith in 2022 with 2.17 billion.
Parker-Hannifin's consistent upward trajectory highlights its robust market strategies and adaptability, especially evident in the 2023 fiscal year. In contrast, Expeditors International's fluctuating profits reflect the dynamic challenges of the logistics industry, with a notable dip in 2023. Missing data for 2024 suggests potential volatility or strategic shifts. As these industry leaders navigate future economic landscapes, their financial performances will be pivotal in shaping sector trends.

Revenue Insights: Parker-Hannifin Corporation and Expeditors International of Washington, Inc. Performance Compared
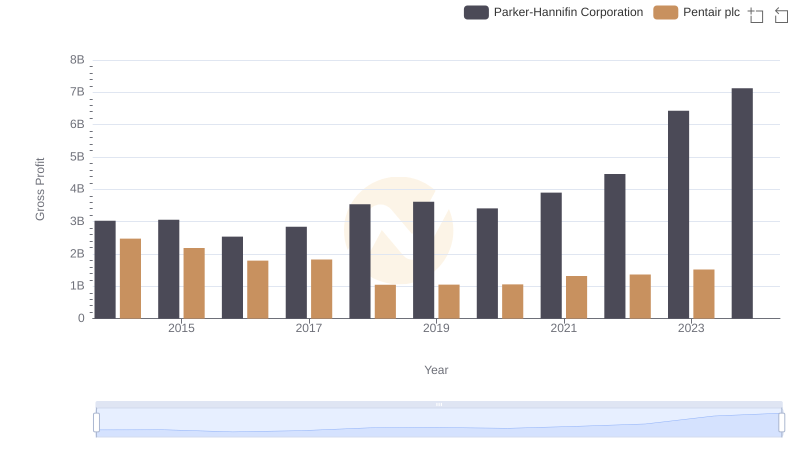
Parker-Hannifin Corporation vs Pentair plc: A Gross Profit Performance Breakdown
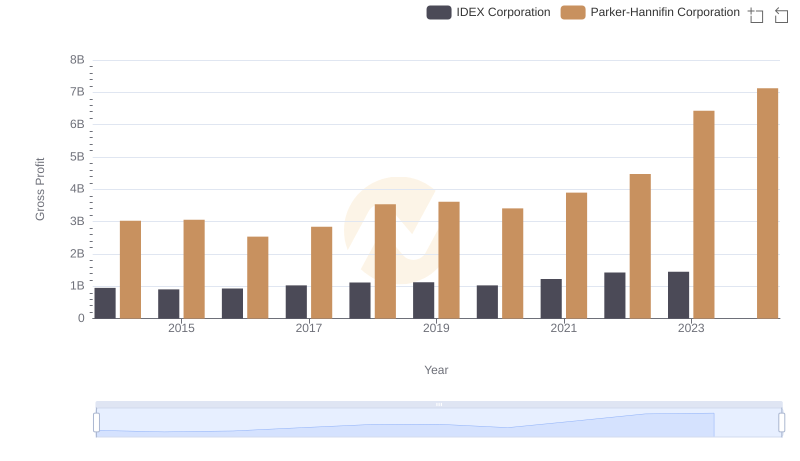
Gross Profit Analysis: Comparing Parker-Hannifin Corporation and IDEX Corporation
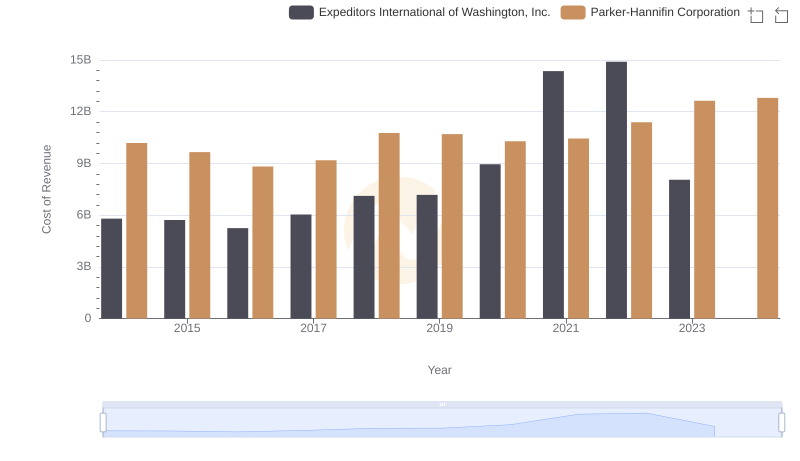
Cost of Revenue: Key Insights for Parker-Hannifin Corporation and Expeditors International of Washington, Inc.
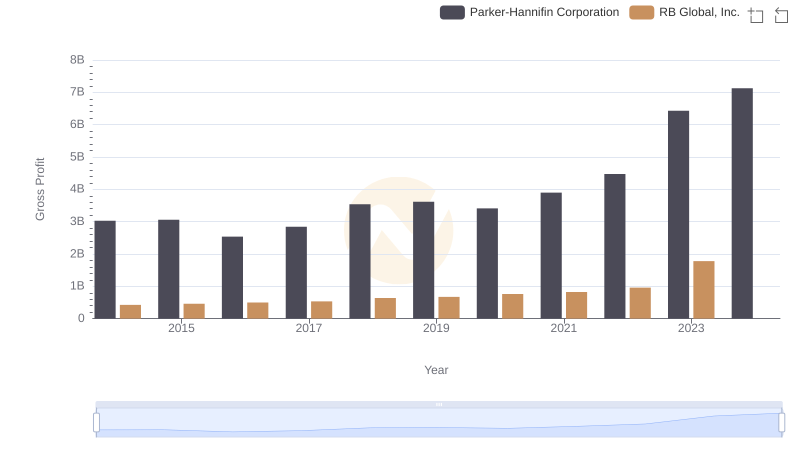
Who Generates Higher Gross Profit? Parker-Hannifin Corporation or RB Global, Inc.
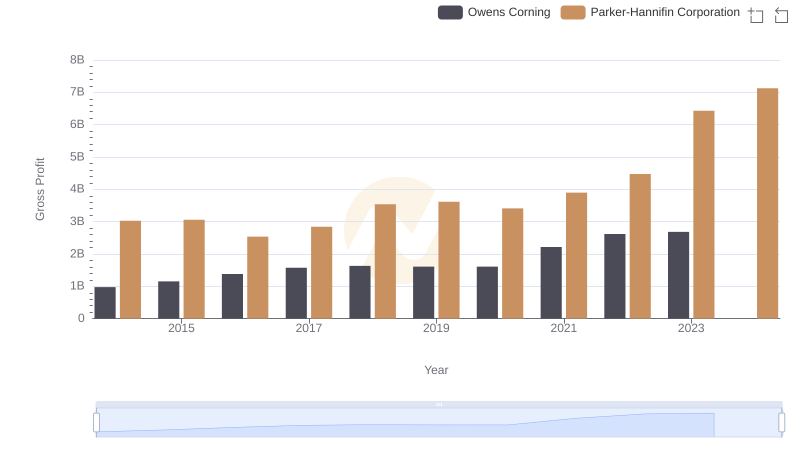
Gross Profit Trends Compared: Parker-Hannifin Corporation vs Owens Corning
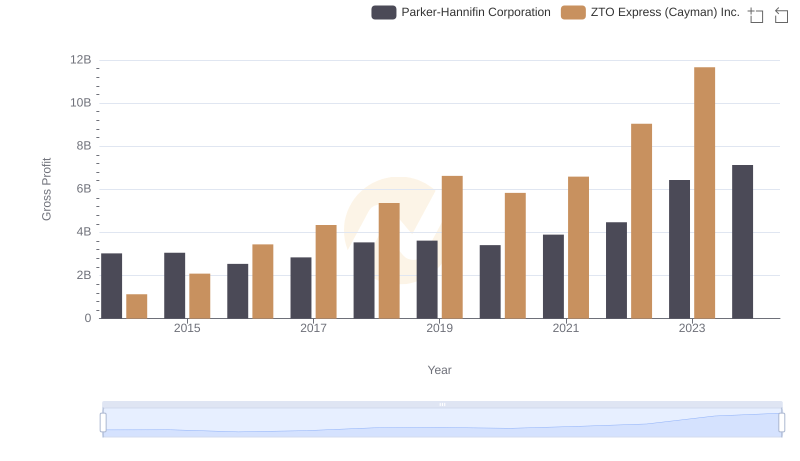
Who Generates Higher Gross Profit? Parker-Hannifin Corporation or ZTO Express (Cayman) Inc.
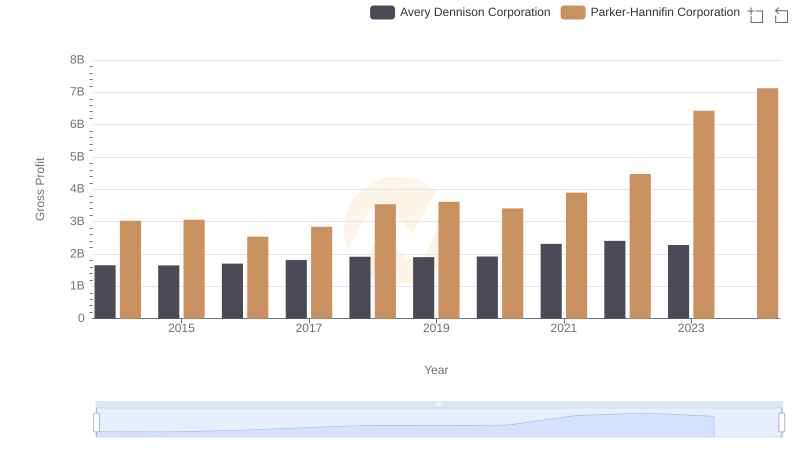
Gross Profit Comparison: Parker-Hannifin Corporation and Avery Dennison Corporation Trends
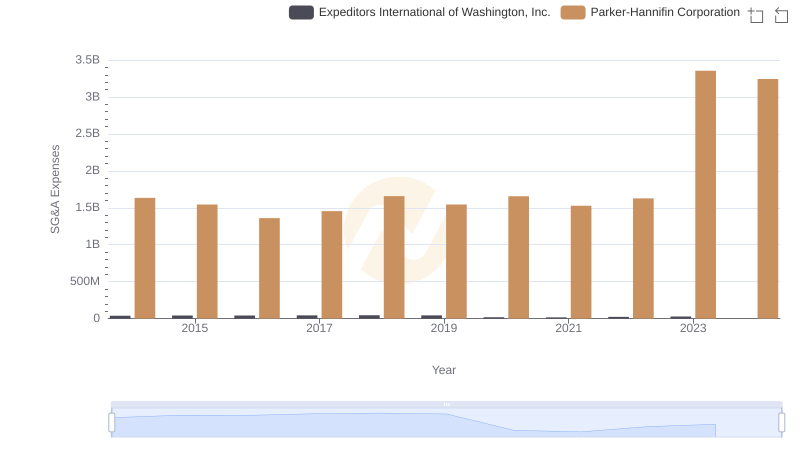
Who Optimizes SG&A Costs Better? Parker-Hannifin Corporation or Expeditors International of Washington, Inc.
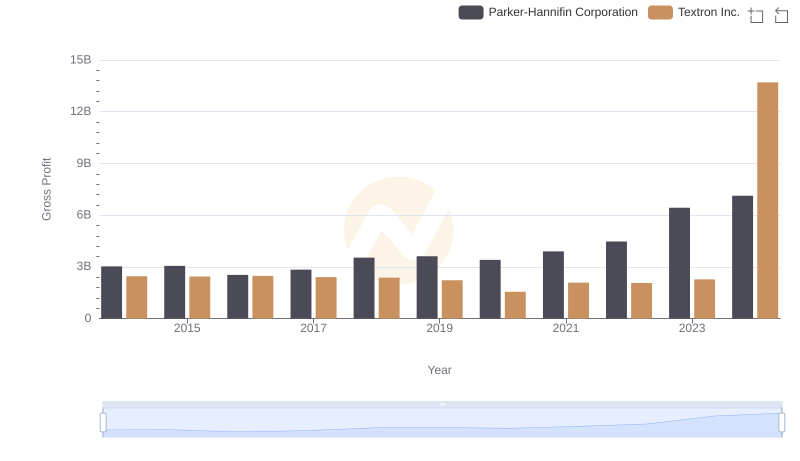
Who Generates Higher Gross Profit? Parker-Hannifin Corporation or Textron Inc.
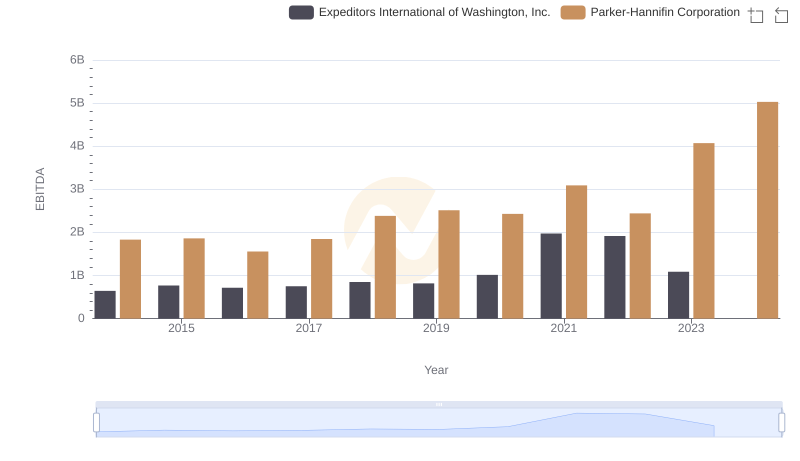
A Professional Review of EBITDA: Parker-Hannifin Corporation Compared to Expeditors International of Washington, Inc.