| __timestamp | Parker-Hannifin Corporation | RB Global, Inc. |
|---|---|---|
| Wednesday, January 1, 2014 | 1633992000 | 248220000 |
| Thursday, January 1, 2015 | 1544746000 | 254990000 |
| Friday, January 1, 2016 | 1359360000 | 283529000 |
| Sunday, January 1, 2017 | 1453935000 | 323270000 |
| Monday, January 1, 2018 | 1657152000 | 382676000 |
| Tuesday, January 1, 2019 | 1543939000 | 382389000 |
| Wednesday, January 1, 2020 | 1656553000 | 417523000 |
| Friday, January 1, 2021 | 1527302000 | 464599000 |
| Saturday, January 1, 2022 | 1627116000 | 539933000 |
| Sunday, January 1, 2023 | 3354103000 | 743700000 |
| Monday, January 1, 2024 | 3315177000 | 773900000 |
Unleashing insights
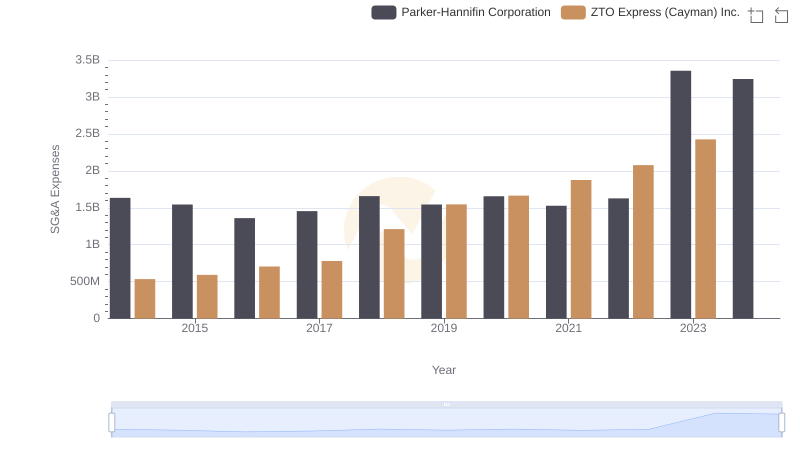
In the ever-evolving landscape of industrial giants, understanding the financial dynamics of companies like Parker-Hannifin Corporation and RB Global, Inc. is crucial. Over the past decade, Parker-Hannifin has consistently outpaced RB Global in Selling, General, and Administrative (SG&A) expenses, reflecting its expansive operational scale. Notably, in 2023, Parker-Hannifin's SG&A expenses surged to over double its 2022 figures, reaching a peak of approximately $3.35 billion. This represents a staggering 106% increase from the previous year, highlighting significant strategic investments or operational expansions.
Conversely, RB Global's SG&A expenses have shown a steady upward trend, culminating in a 54% increase from 2014 to 2023. However, data for 2024 remains incomplete, leaving room for speculation on future financial strategies. This comparative analysis underscores the diverse financial strategies employed by these industry leaders, offering valuable insights into their operational priorities.
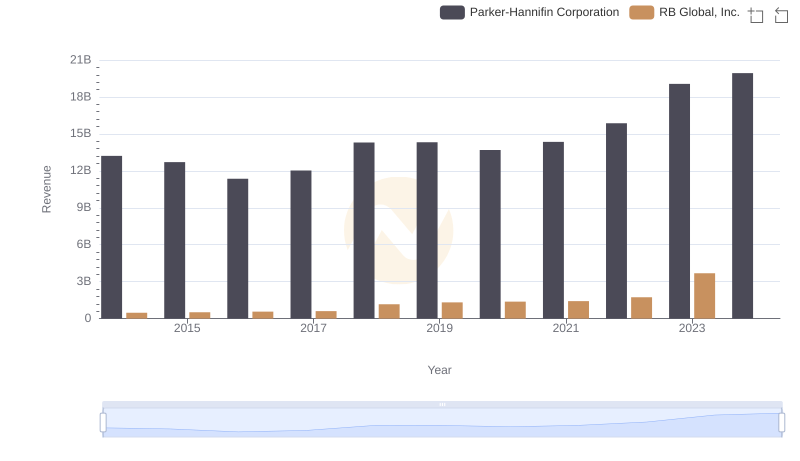
Breaking Down Revenue Trends: Parker-Hannifin Corporation vs RB Global, Inc.
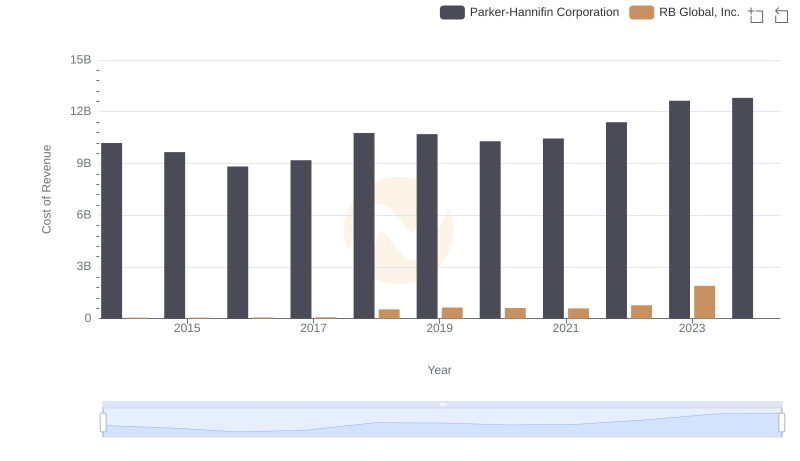
Cost Insights: Breaking Down Parker-Hannifin Corporation and RB Global, Inc.'s Expenses
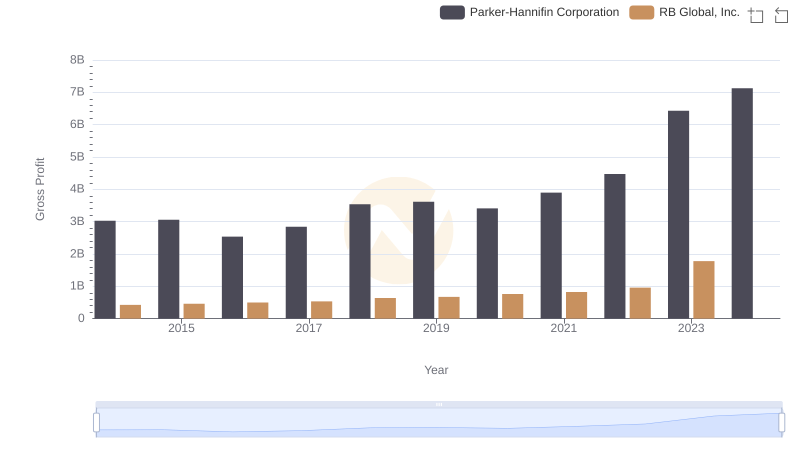
Who Generates Higher Gross Profit? Parker-Hannifin Corporation or RB Global, Inc.
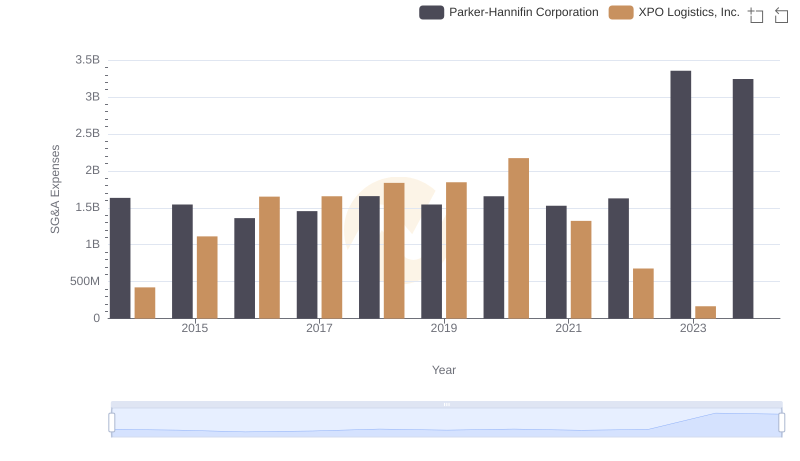
Parker-Hannifin Corporation vs XPO Logistics, Inc.: SG&A Expense Trends
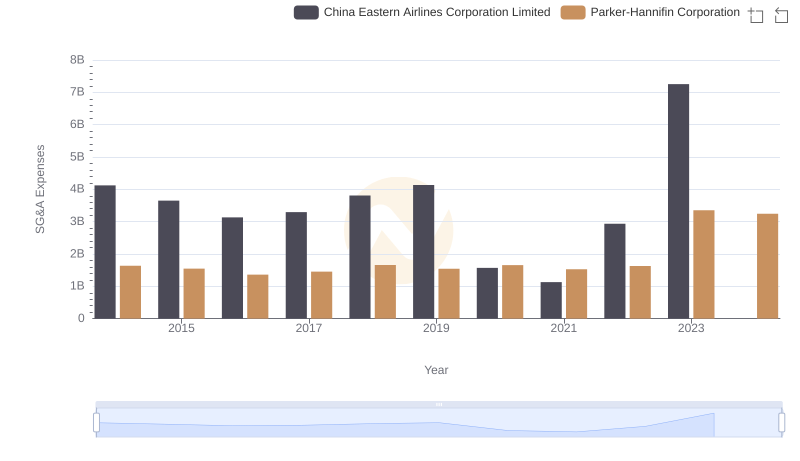
Parker-Hannifin Corporation vs China Eastern Airlines Corporation Limited: SG&A Expense Trends
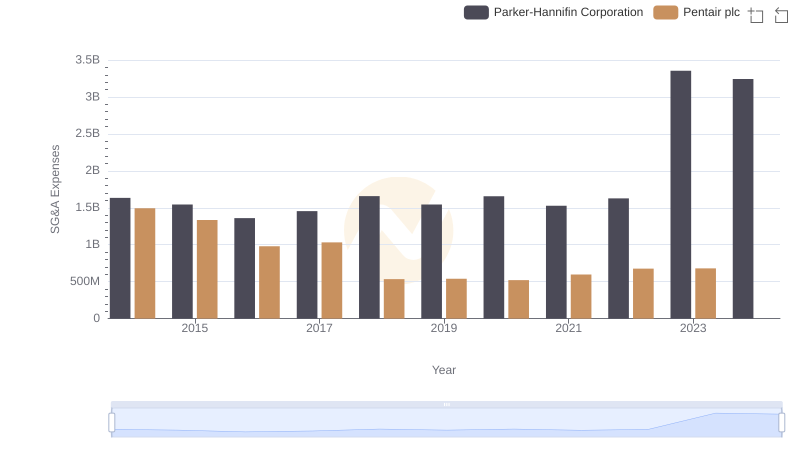
Who Optimizes SG&A Costs Better? Parker-Hannifin Corporation or Pentair plc
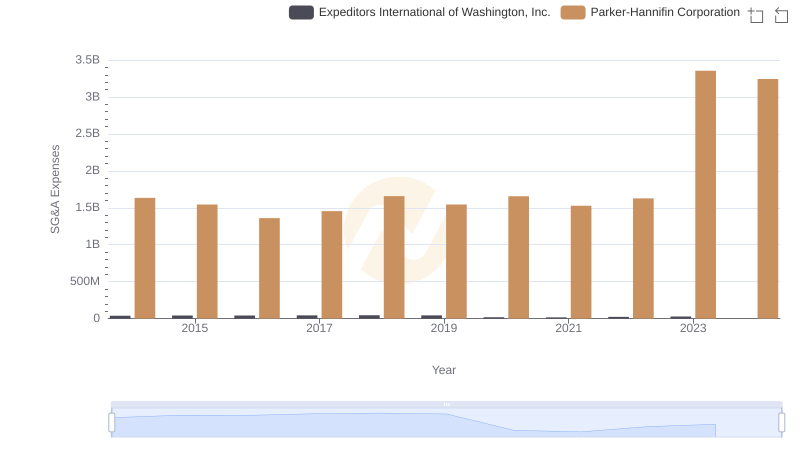
Who Optimizes SG&A Costs Better? Parker-Hannifin Corporation or Expeditors International of Washington, Inc.
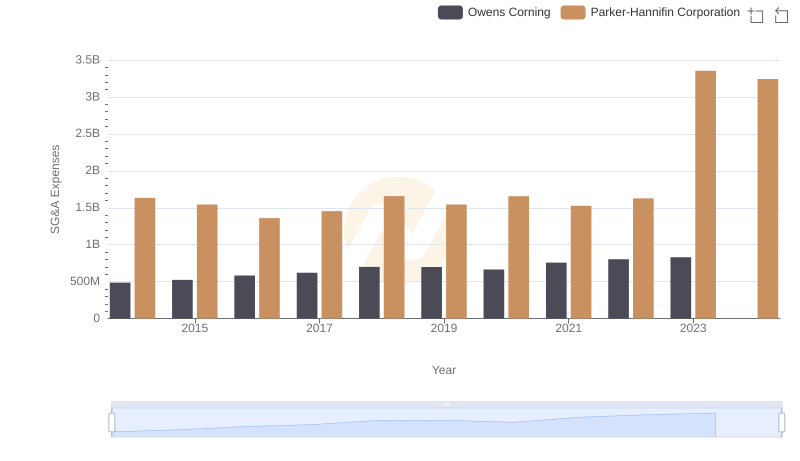
Operational Costs Compared: SG&A Analysis of Parker-Hannifin Corporation and Owens Corning
SG&A Efficiency Analysis: Comparing Parker-Hannifin Corporation and ZTO Express (Cayman) Inc.