| __timestamp | Check Point Software Technologies Ltd. | Intuit Inc. |
|---|---|---|
| Wednesday, January 1, 2014 | 1319275000 | 3838000000 |
| Thursday, January 1, 2015 | 1440781000 | 3467000000 |
| Friday, January 1, 2016 | 1539298000 | 3942000000 |
| Sunday, January 1, 2017 | 1641695000 | 4368000000 |
| Monday, January 1, 2018 | 1715096000 | 4987000000 |
| Tuesday, January 1, 2019 | 1779400000 | 5617000000 |
| Wednesday, January 1, 2020 | 1838400000 | 6301000000 |
| Friday, January 1, 2021 | 1908700000 | 7950000000 |
| Saturday, January 1, 2022 | 2025500000 | 10320000000 |
| Sunday, January 1, 2023 | 2132100000 | 11225000000 |
| Monday, January 1, 2024 | 12820000000 |
Data in motion
In the ever-evolving tech industry, financial performance is a key indicator of a company's success. Over the past decade, Intuit Inc. has consistently outperformed Check Point Software Technologies Ltd. in terms of gross profit. From 2014 to 2023, Intuit's gross profit surged by approximately 193%, reaching a peak of $11.225 billion in 2023. In contrast, Check Point's growth was more modest, with a 62% increase, culminating in a gross profit of $2.132 billion in the same year.
This trend highlights Intuit's robust growth strategy and market adaptability, particularly in the financial software sector. Meanwhile, Check Point, a leader in cybersecurity, has maintained steady growth, albeit at a slower pace. The data for 2024 is incomplete, but the trajectory suggests Intuit's dominance in gross profit generation is likely to continue.
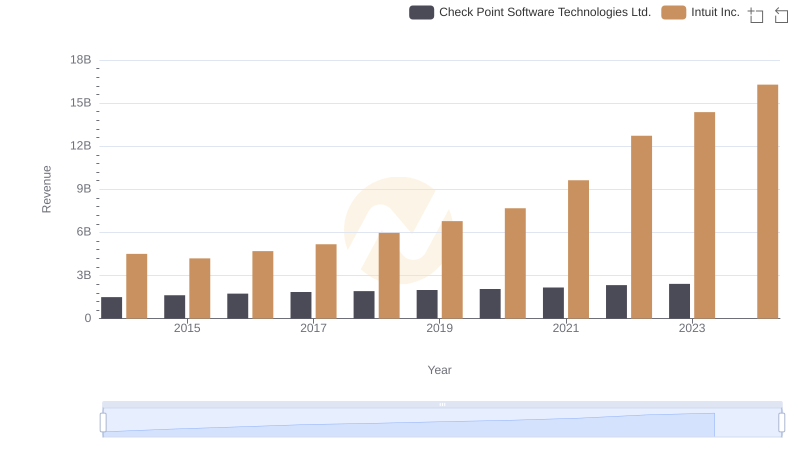
Intuit Inc. and Check Point Software Technologies Ltd.: A Comprehensive Revenue Analysis
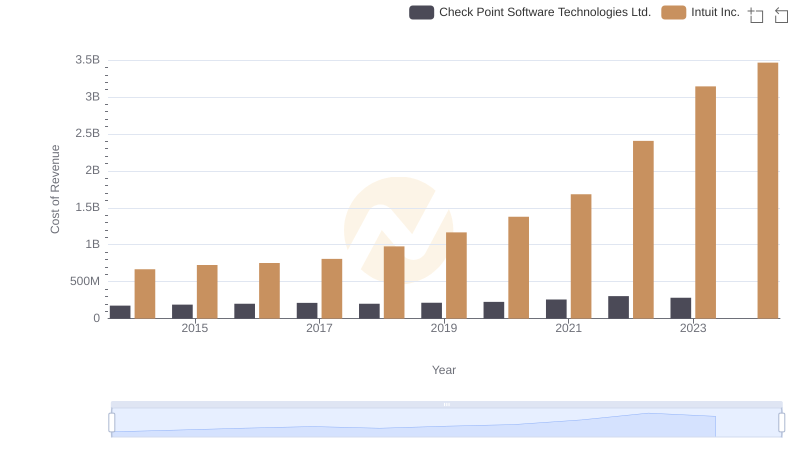
Comparing Cost of Revenue Efficiency: Intuit Inc. vs Check Point Software Technologies Ltd.
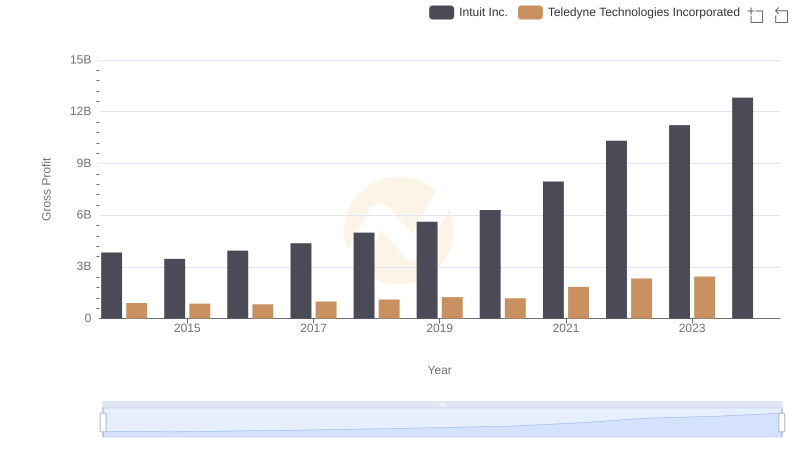
Intuit Inc. vs Teledyne Technologies Incorporated: A Gross Profit Performance Breakdown
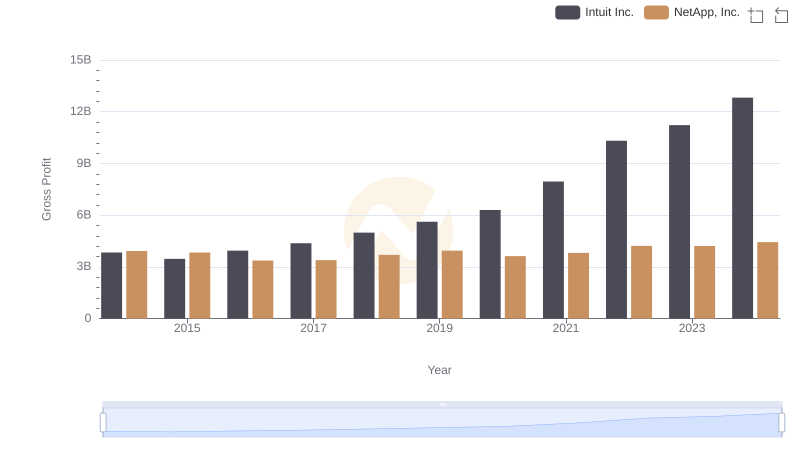
Gross Profit Trends Compared: Intuit Inc. vs NetApp, Inc.

Intuit Inc. vs ON Semiconductor Corporation: A Gross Profit Performance Breakdown
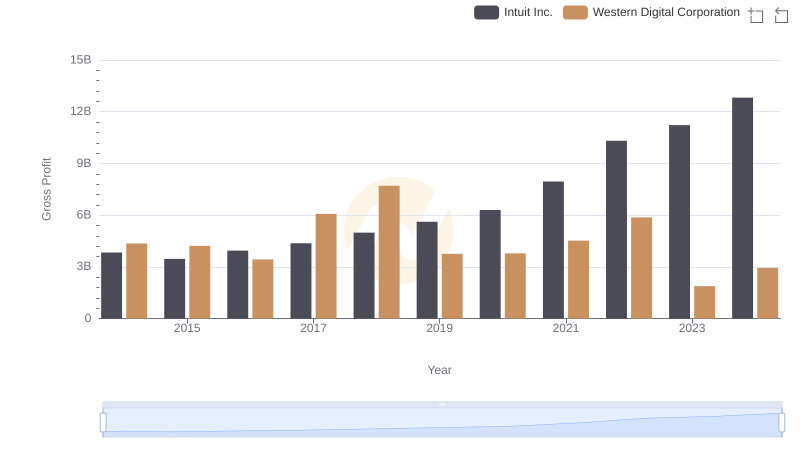
Intuit Inc. and Western Digital Corporation: A Detailed Gross Profit Analysis
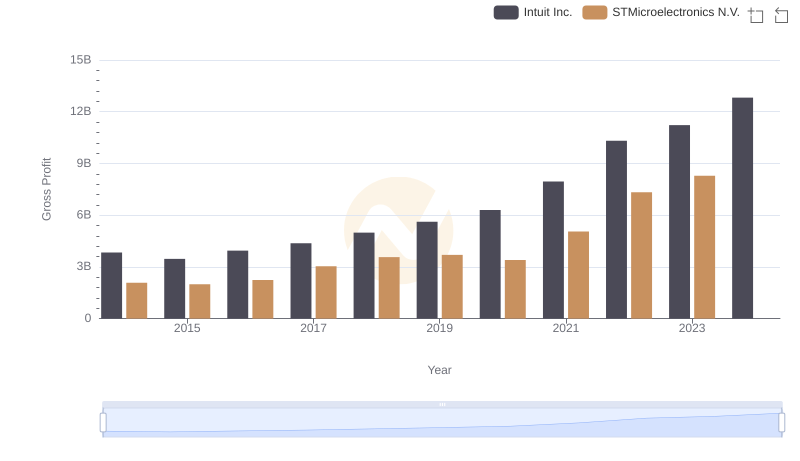
Gross Profit Analysis: Comparing Intuit Inc. and STMicroelectronics N.V.
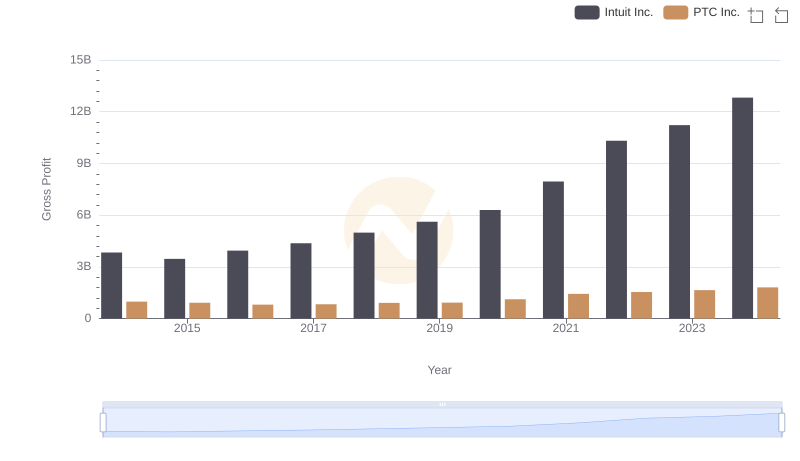
Gross Profit Analysis: Comparing Intuit Inc. and PTC Inc.
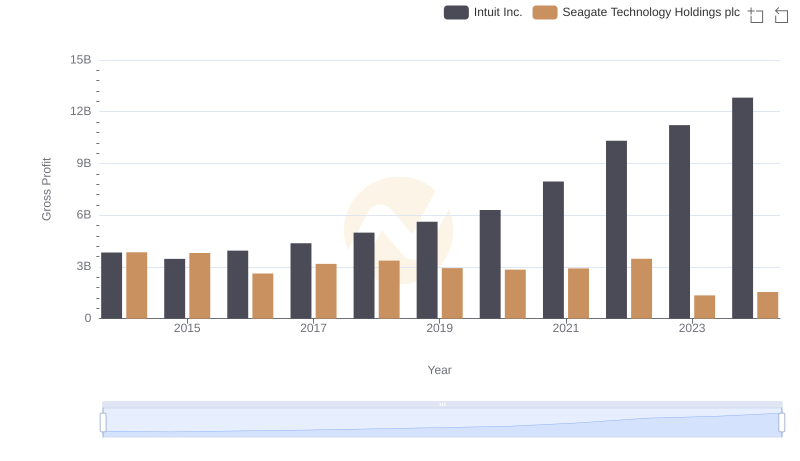
Gross Profit Analysis: Comparing Intuit Inc. and Seagate Technology Holdings plc
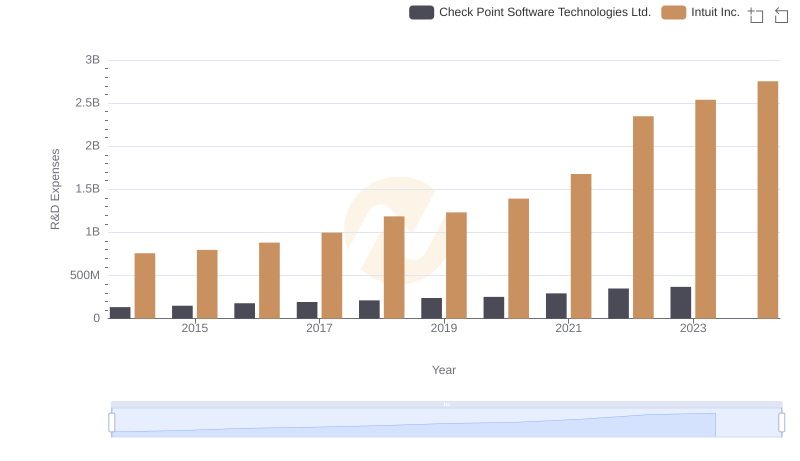
R&D Spending Showdown: Intuit Inc. vs Check Point Software Technologies Ltd.
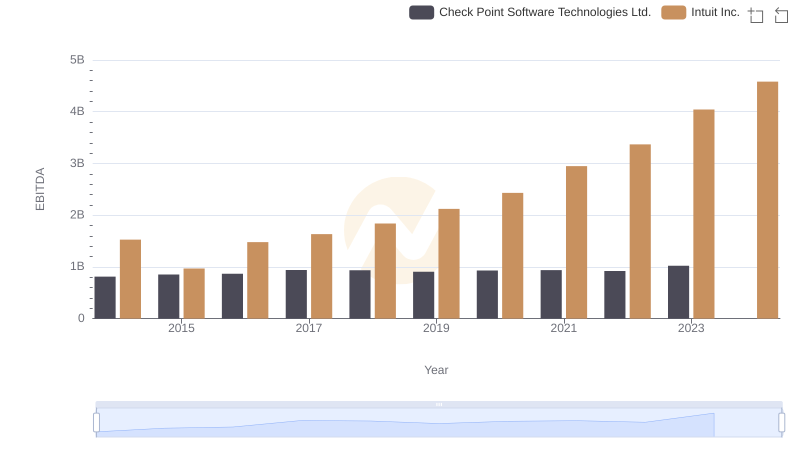
Professional EBITDA Benchmarking: Intuit Inc. vs Check Point Software Technologies Ltd.