| __timestamp | Clean Harbors, Inc. | EMCOR Group, Inc. |
|---|---|---|
| Wednesday, January 1, 2014 | 959840000 | 907246000 |
| Thursday, January 1, 2015 | 918331000 | 944479000 |
| Friday, January 1, 2016 | 822369000 | 1037862000 |
| Sunday, January 1, 2017 | 882305000 | 1147012000 |
| Monday, January 1, 2018 | 994752000 | 1205453000 |
| Tuesday, January 1, 2019 | 1024371000 | 1355868000 |
| Wednesday, January 1, 2020 | 1006346000 | 1395382000 |
| Friday, January 1, 2021 | 1195729000 | 1501737000 |
| Saturday, January 1, 2022 | 1622675000 | 1603594000 |
| Sunday, January 1, 2023 | 1663028000 | 2089339000 |
| Monday, January 1, 2024 | 1824239000 |
In pursuit of knowledge
In the ever-evolving landscape of industrial services, EMCOR Group, Inc. and Clean Harbors, Inc. have emerged as formidable players. Over the past decade, from 2014 to 2023, these companies have demonstrated remarkable growth in gross profit, reflecting their strategic prowess and market adaptability.
EMCOR Group, Inc.: Witnessing a robust 130% increase in gross profit, EMCOR's financial trajectory underscores its resilience and strategic expansion. By 2023, the company achieved a gross profit of approximately $2.1 billion, a testament to its operational efficiency and market penetration.
Clean Harbors, Inc.: Not to be outdone, Clean Harbors experienced a commendable 73% rise in gross profit over the same period. By 2023, the company reached a gross profit of around $1.7 billion, highlighting its commitment to sustainable growth and environmental stewardship.
This analysis offers a compelling glimpse into the financial health and strategic direction of these industry leaders.
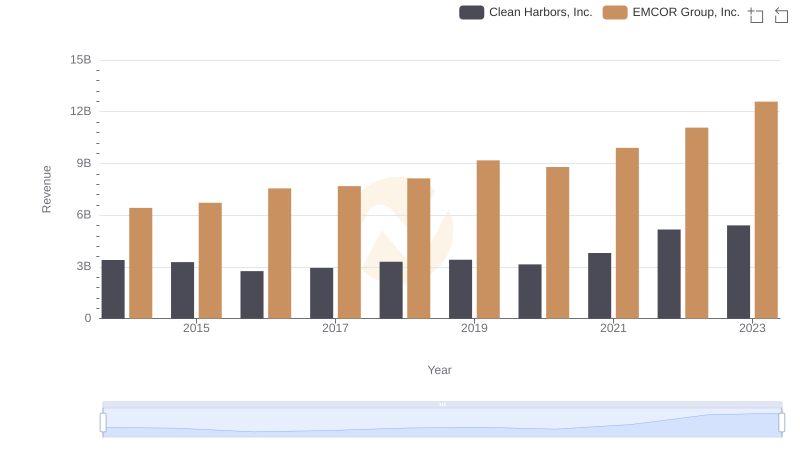
Breaking Down Revenue Trends: EMCOR Group, Inc. vs Clean Harbors, Inc.
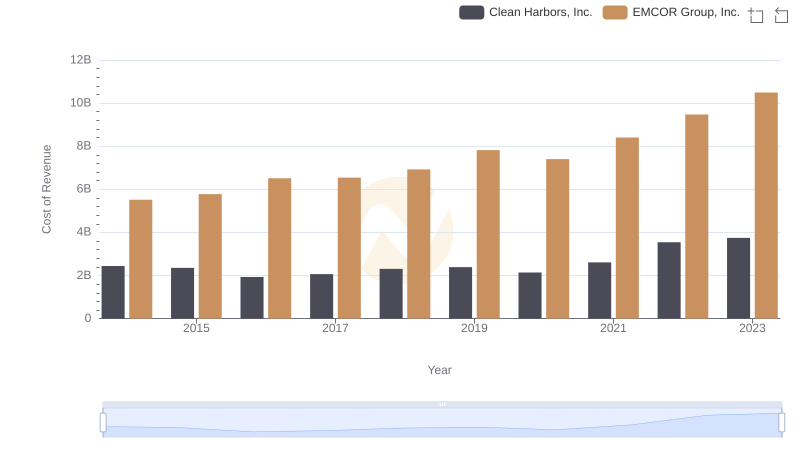
Cost of Revenue Trends: EMCOR Group, Inc. vs Clean Harbors, Inc.
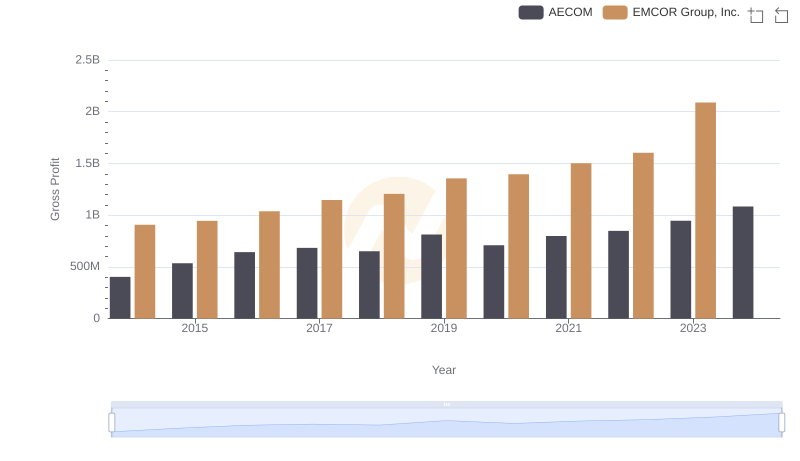
Who Generates Higher Gross Profit? EMCOR Group, Inc. or AECOM
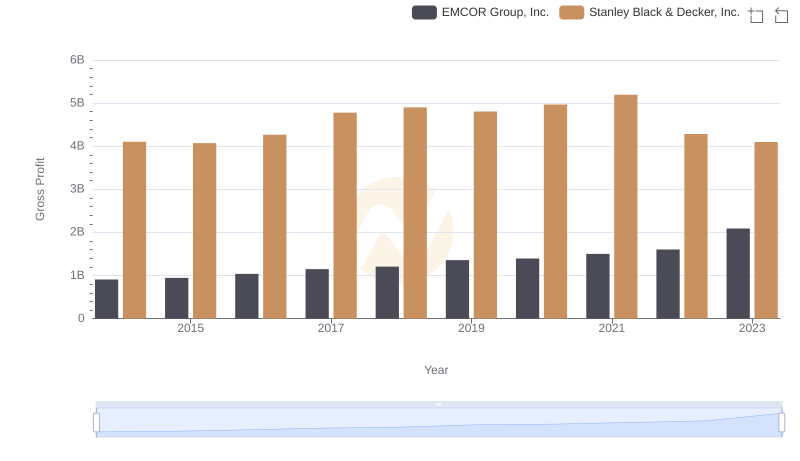
Gross Profit Comparison: EMCOR Group, Inc. and Stanley Black & Decker, Inc. Trends
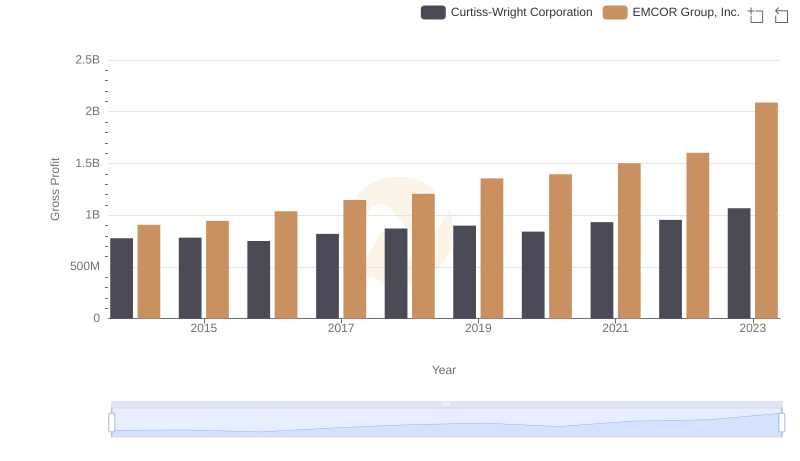
EMCOR Group, Inc. and Curtiss-Wright Corporation: A Detailed Gross Profit Analysis

Gross Profit Analysis: Comparing EMCOR Group, Inc. and U-Haul Holding Company
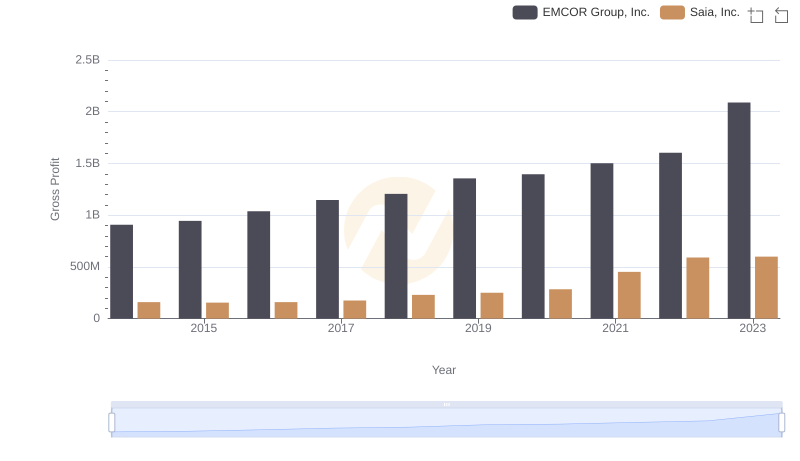
Gross Profit Trends Compared: EMCOR Group, Inc. vs Saia, Inc.
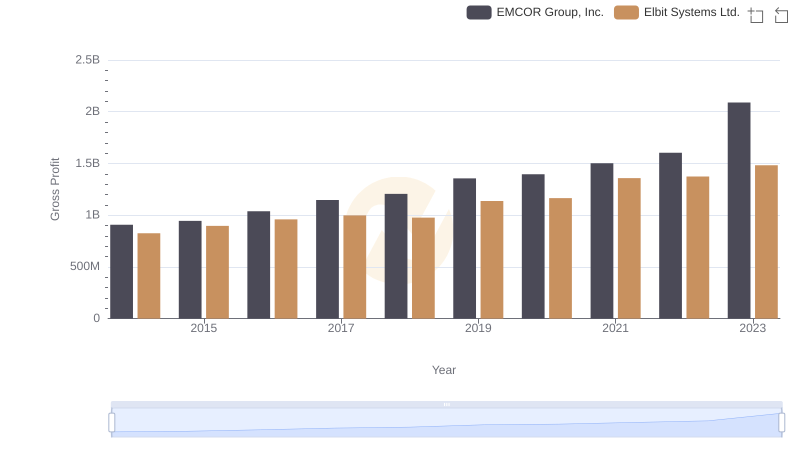
EMCOR Group, Inc. vs Elbit Systems Ltd.: A Gross Profit Performance Breakdown
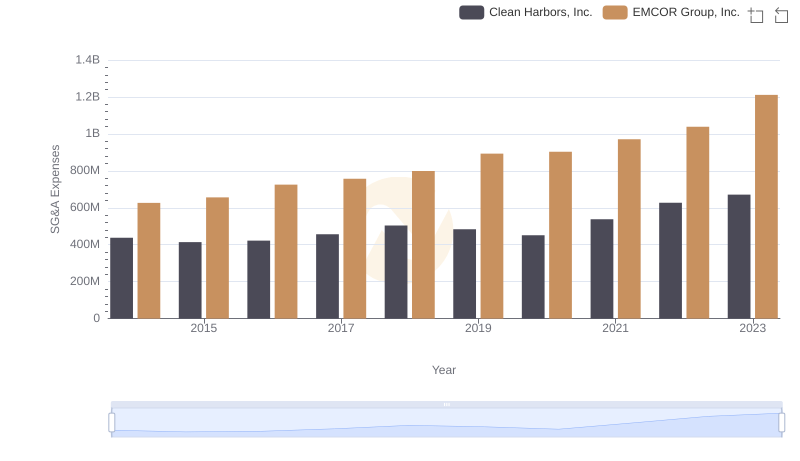
EMCOR Group, Inc. and Clean Harbors, Inc.: SG&A Spending Patterns Compared
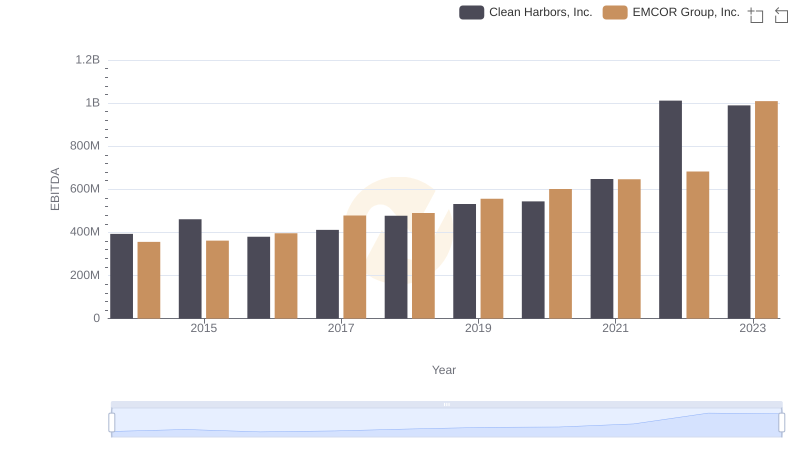
EBITDA Metrics Evaluated: EMCOR Group, Inc. vs Clean Harbors, Inc.