| __timestamp | EMCOR Group, Inc. | Saia, Inc. |
|---|---|---|
| Wednesday, January 1, 2014 | 907246000 | 159268000 |
| Thursday, January 1, 2015 | 944479000 | 154120000 |
| Friday, January 1, 2016 | 1037862000 | 159502000 |
| Sunday, January 1, 2017 | 1147012000 | 175046000 |
| Monday, January 1, 2018 | 1205453000 | 230070000 |
| Tuesday, January 1, 2019 | 1355868000 | 249653000 |
| Wednesday, January 1, 2020 | 1395382000 | 283848000 |
| Friday, January 1, 2021 | 1501737000 | 451687000 |
| Saturday, January 1, 2022 | 1603594000 | 590963000 |
| Sunday, January 1, 2023 | 2089339000 | 598932000 |
Data in motion
In the competitive landscape of the U.S. stock market, understanding the financial health of companies is crucial. This analysis focuses on the gross profit trends of EMCOR Group, Inc. and Saia, Inc. over the past decade, from 2014 to 2023.
EMCOR Group, Inc. has demonstrated a robust growth trajectory, with its gross profit increasing by approximately 130% over this period. Notably, the year 2023 marked a significant milestone, with a gross profit of over $2 billion, reflecting a 30% increase from the previous year. In contrast, Saia, Inc. has shown a steady upward trend, with its gross profit growing by nearly 280% since 2014. The year 2022 was particularly remarkable for Saia, Inc., with a 31% increase in gross profit compared to 2021.
These trends highlight the dynamic nature of the industry and the strategic maneuvers by these companies to enhance their profitability.
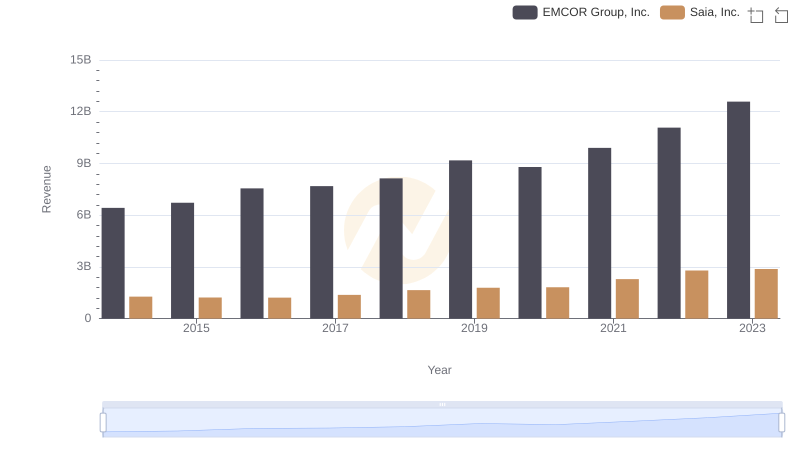
EMCOR Group, Inc. or Saia, Inc.: Who Leads in Yearly Revenue?

Comparing Cost of Revenue Efficiency: EMCOR Group, Inc. vs Saia, Inc.
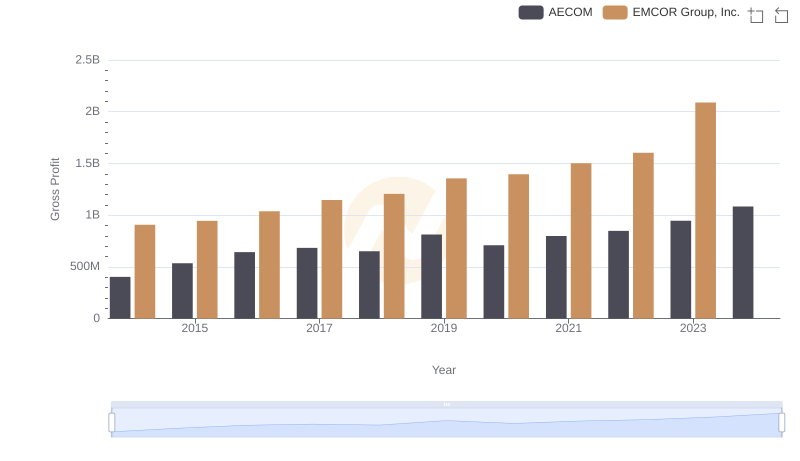
Who Generates Higher Gross Profit? EMCOR Group, Inc. or AECOM
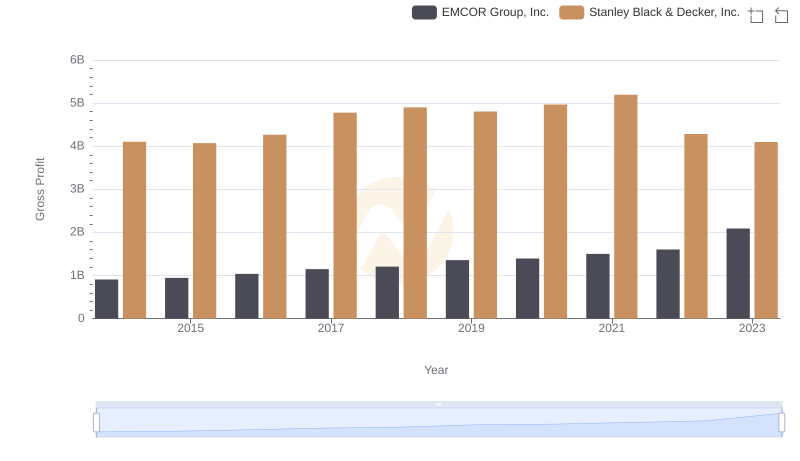
Gross Profit Comparison: EMCOR Group, Inc. and Stanley Black & Decker, Inc. Trends
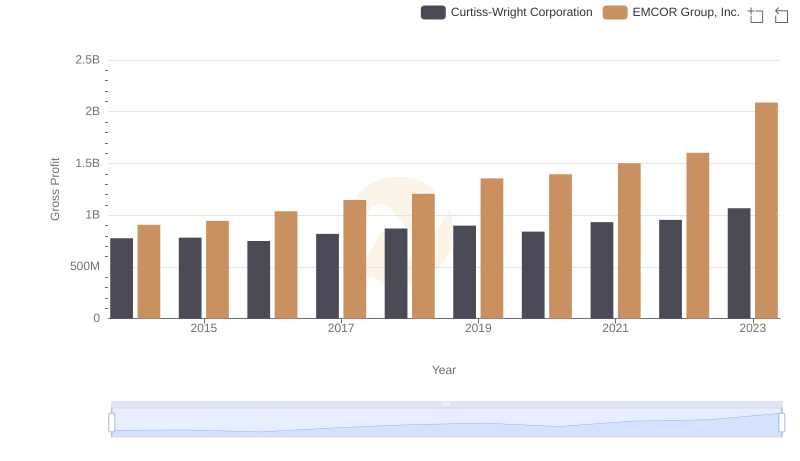
EMCOR Group, Inc. and Curtiss-Wright Corporation: A Detailed Gross Profit Analysis

Gross Profit Analysis: Comparing EMCOR Group, Inc. and U-Haul Holding Company
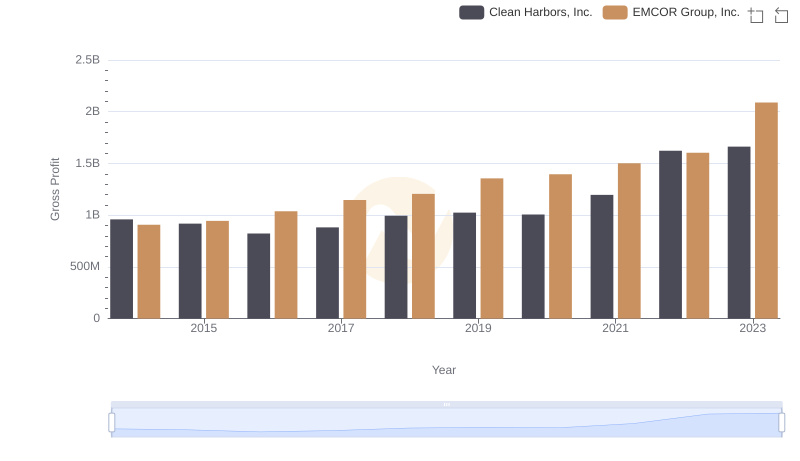
EMCOR Group, Inc. and Clean Harbors, Inc.: A Detailed Gross Profit Analysis
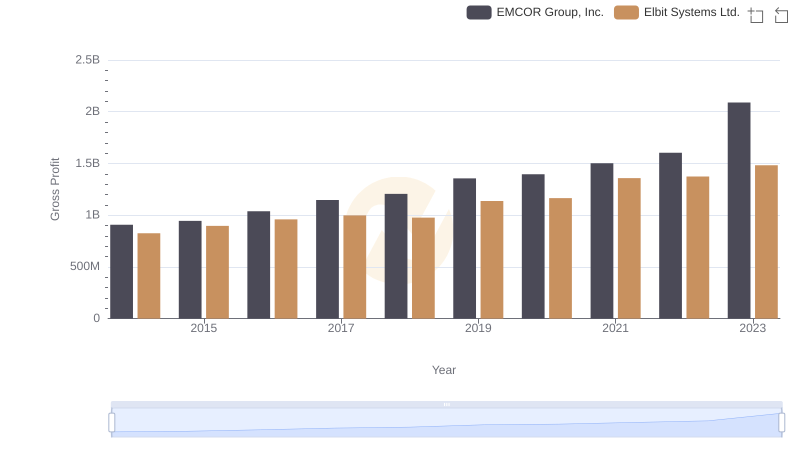
EMCOR Group, Inc. vs Elbit Systems Ltd.: A Gross Profit Performance Breakdown
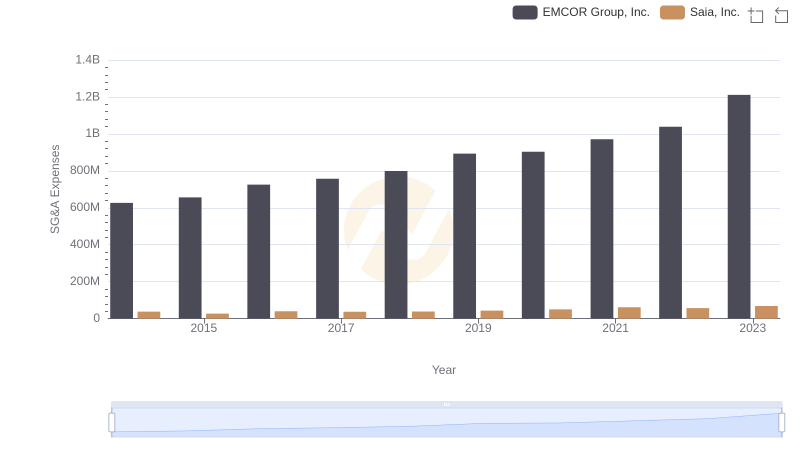
SG&A Efficiency Analysis: Comparing EMCOR Group, Inc. and Saia, Inc.
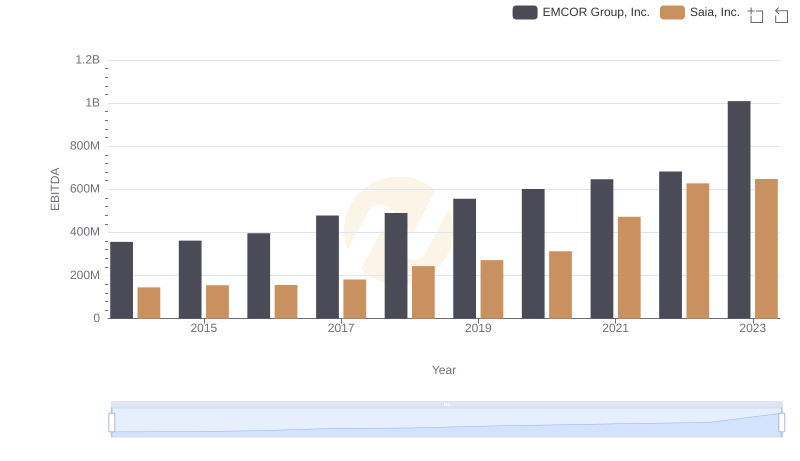
A Side-by-Side Analysis of EBITDA: EMCOR Group, Inc. and Saia, Inc.