| __timestamp | AMETEK, Inc. | Pentair plc |
|---|---|---|
| Wednesday, January 1, 2014 | 1424947000 | 2476000000 |
| Thursday, January 1, 2015 | 1425015000 | 2185800000 |
| Friday, January 1, 2016 | 1264867000 | 1794100000 |
| Sunday, January 1, 2017 | 1448739000 | 1829100000 |
| Monday, January 1, 2018 | 1659562000 | 1047700000 |
| Tuesday, January 1, 2019 | 1787660000 | 1051500000 |
| Wednesday, January 1, 2020 | 1543514000 | 1057600000 |
| Friday, January 1, 2021 | 1912614000 | 1319200000 |
| Saturday, January 1, 2022 | 2145269000 | 1364600000 |
| Sunday, January 1, 2023 | 2384465001 | 1519200000 |
| Monday, January 1, 2024 | 6941180000 | 1598800000 |
Unleashing insights
In the ever-evolving landscape of industrial manufacturing, understanding financial performance is crucial. This analysis delves into the gross profit trends of two industry giants, AMETEK, Inc. and Pentair plc, from 2014 to 2023. Over this period, AMETEK, Inc. has demonstrated a robust growth trajectory, with its gross profit increasing by approximately 67%, from $1.42 billion in 2014 to $2.38 billion in 2023. In contrast, Pentair plc experienced a more volatile journey, with a notable decline of around 39% from its peak in 2014 at $2.48 billion to $1.52 billion in 2023.
This divergence highlights AMETEK's strategic resilience and adaptability in a competitive market, while Pentair's fluctuations suggest challenges that may have impacted its profitability. As we look to the future, these trends offer valuable insights for investors and industry analysts alike.
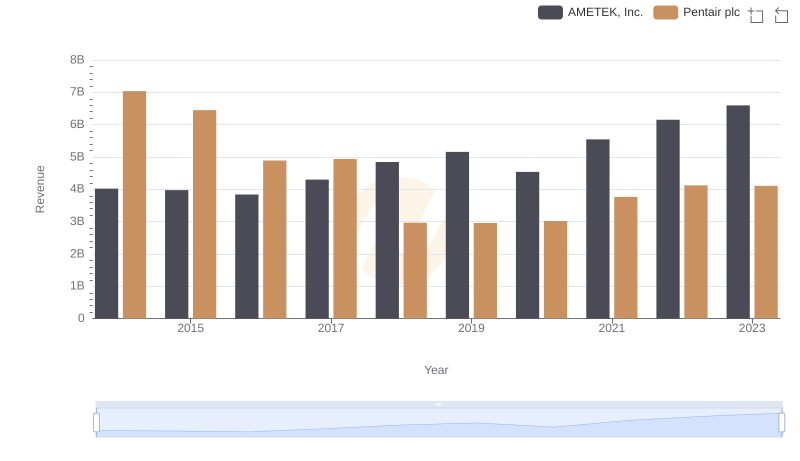
AMETEK, Inc. vs Pentair plc: Annual Revenue Growth Compared
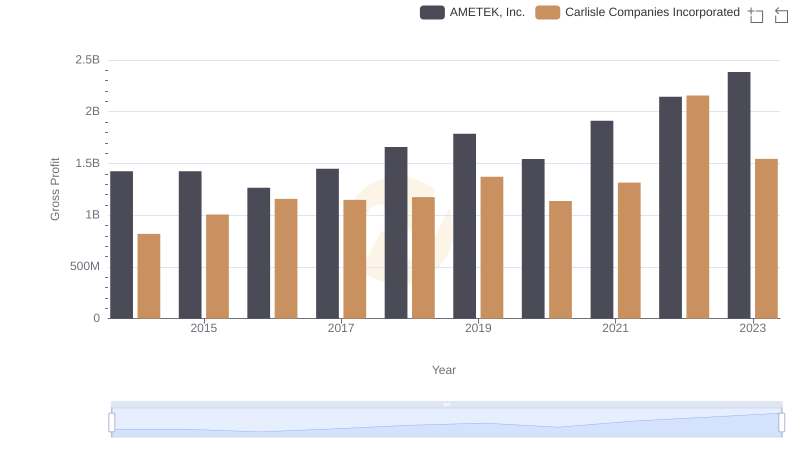
Gross Profit Comparison: AMETEK, Inc. and Carlisle Companies Incorporated Trends
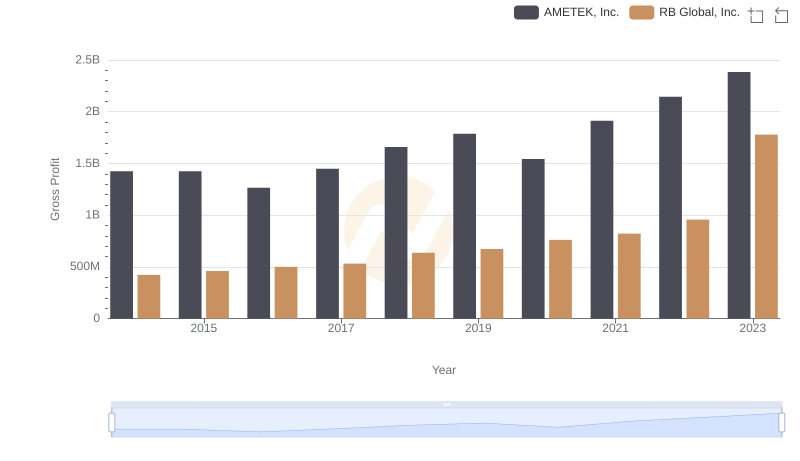
Who Generates Higher Gross Profit? AMETEK, Inc. or RB Global, Inc.
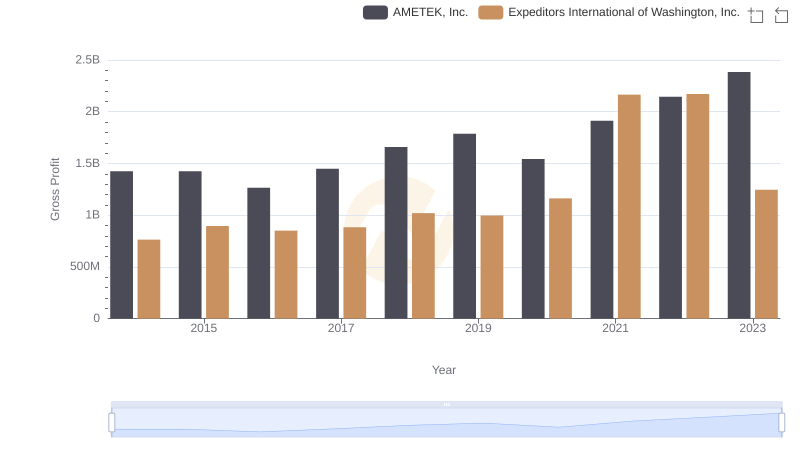
AMETEK, Inc. vs Expeditors International of Washington, Inc.: A Gross Profit Performance Breakdown
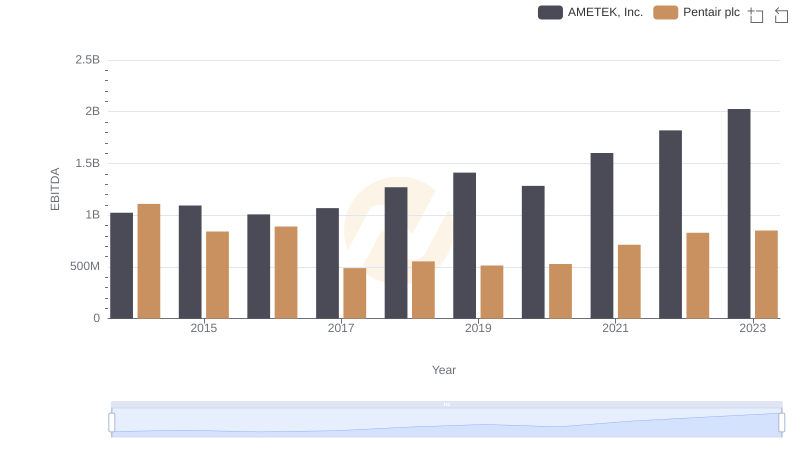
A Professional Review of EBITDA: AMETEK, Inc. Compared to Pentair plc