| __timestamp | AMETEK, Inc. | Expeditors International of Washington, Inc. |
|---|---|---|
| Wednesday, January 1, 2014 | 1424947000 | 763996000 |
| Thursday, January 1, 2015 | 1425015000 | 895784000 |
| Friday, January 1, 2016 | 1264867000 | 850793000 |
| Sunday, January 1, 2017 | 1448739000 | 883027000 |
| Monday, January 1, 2018 | 1659562000 | 1020282000 |
| Tuesday, January 1, 2019 | 1787660000 | 997021000 |
| Wednesday, January 1, 2020 | 1543514000 | 1162765000 |
| Friday, January 1, 2021 | 1912614000 | 2165412000 |
| Saturday, January 1, 2022 | 2145269000 | 2171130000 |
| Sunday, January 1, 2023 | 2384465001 | 1245476000 |
| Monday, January 1, 2024 | 6941180000 | 10600515000 |
Unleashing the power of data
In the competitive landscape of American industry, AMETEK, Inc. and Expeditors International of Washington, Inc. have carved out significant niches. Over the past decade, AMETEK has consistently outperformed its counterpart in terms of gross profit, showcasing a robust growth trajectory. From 2014 to 2023, AMETEK's gross profit surged by approximately 67%, peaking in 2023. In contrast, Expeditors International experienced a more volatile journey, with a notable peak in 2022, followed by a sharp decline in 2023.
This performance breakdown highlights AMETEK's resilience and strategic prowess, especially during challenging economic climates. Meanwhile, Expeditors' fluctuations suggest a more reactive approach to market dynamics. As we look to the future, these trends offer valuable insights into the operational efficiencies and market strategies of these industrial titans.
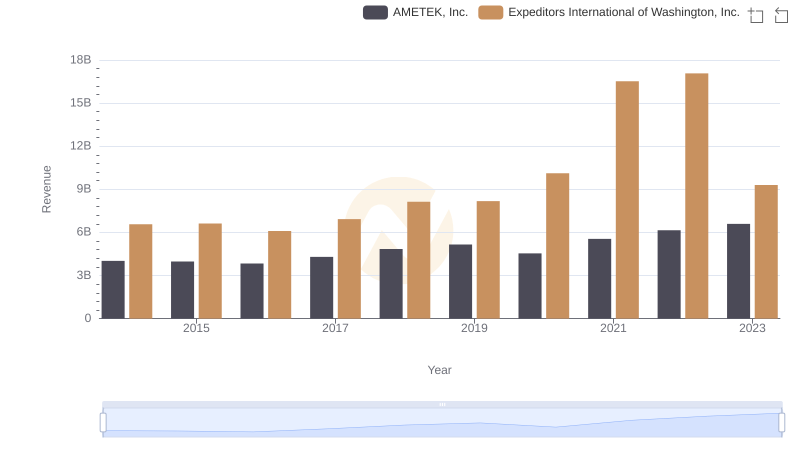
AMETEK, Inc. and Expeditors International of Washington, Inc.: A Comprehensive Revenue Analysis
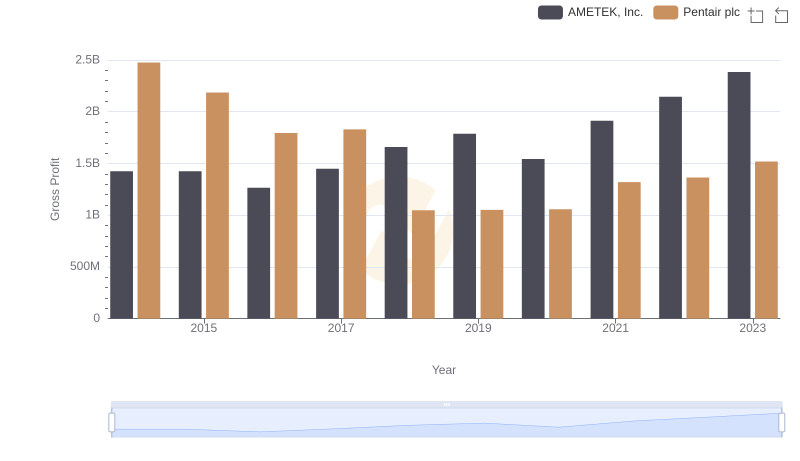
Gross Profit Analysis: Comparing AMETEK, Inc. and Pentair plc
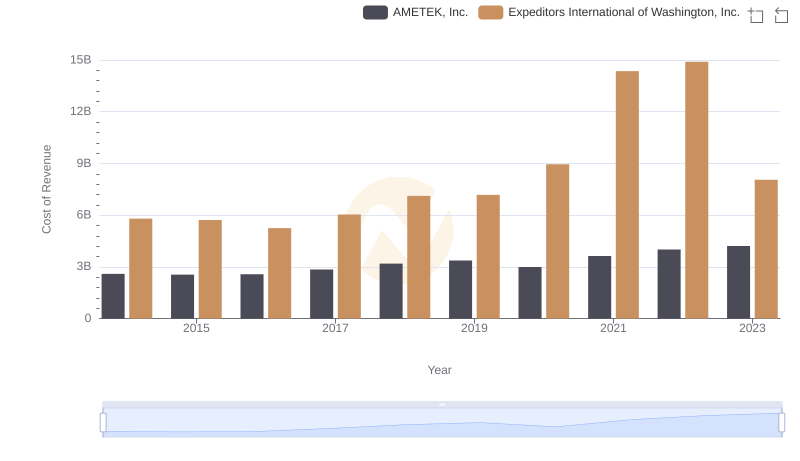
Cost of Revenue Comparison: AMETEK, Inc. vs Expeditors International of Washington, Inc.
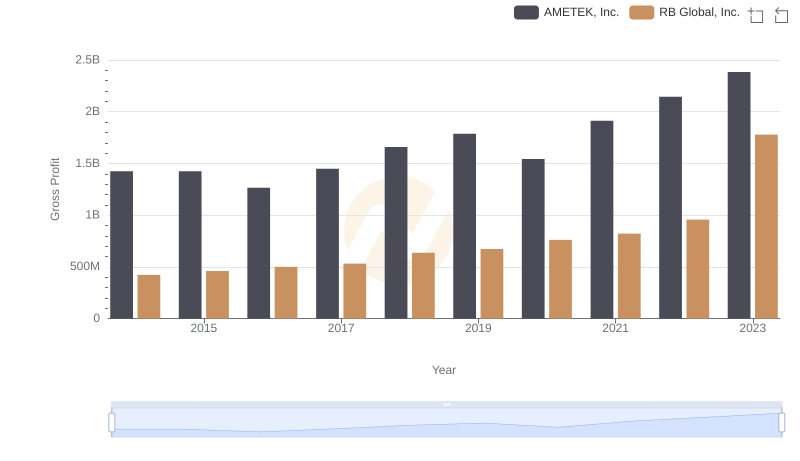
Who Generates Higher Gross Profit? AMETEK, Inc. or RB Global, Inc.
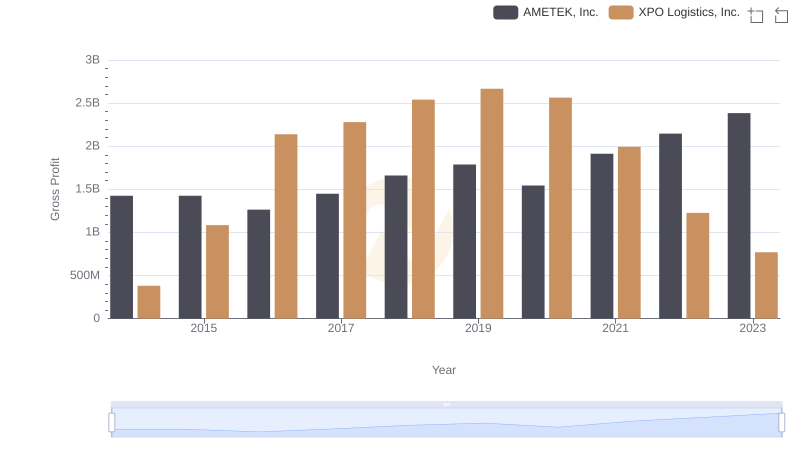
Gross Profit Comparison: AMETEK, Inc. and XPO Logistics, Inc. Trends
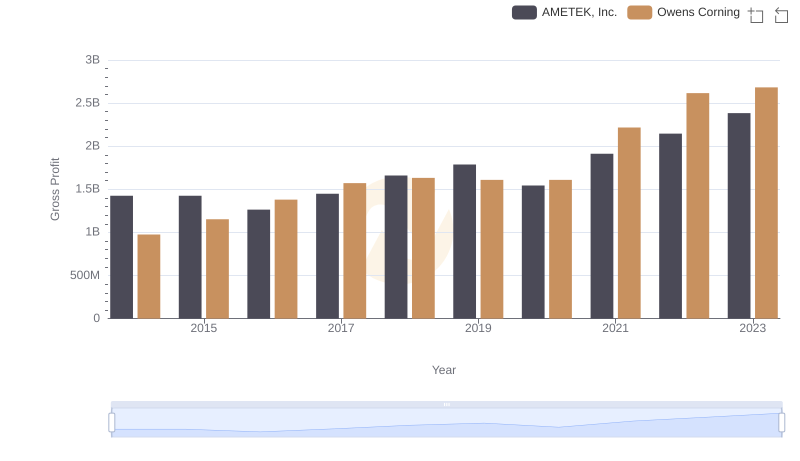
Who Generates Higher Gross Profit? AMETEK, Inc. or Owens Corning
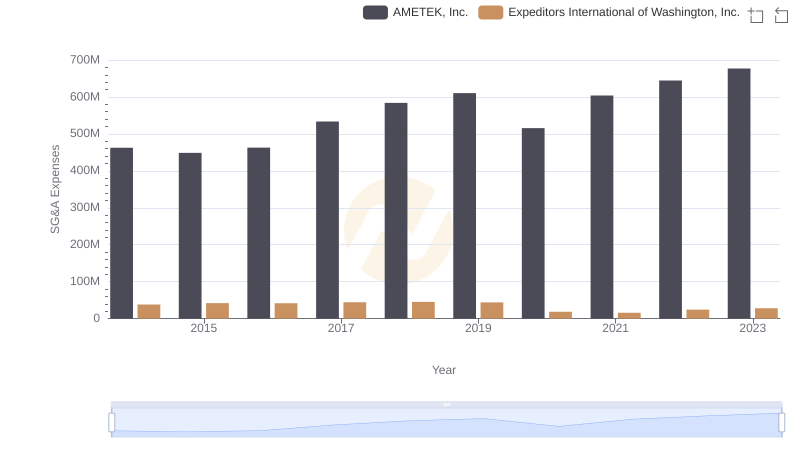
Operational Costs Compared: SG&A Analysis of AMETEK, Inc. and Expeditors International of Washington, Inc.
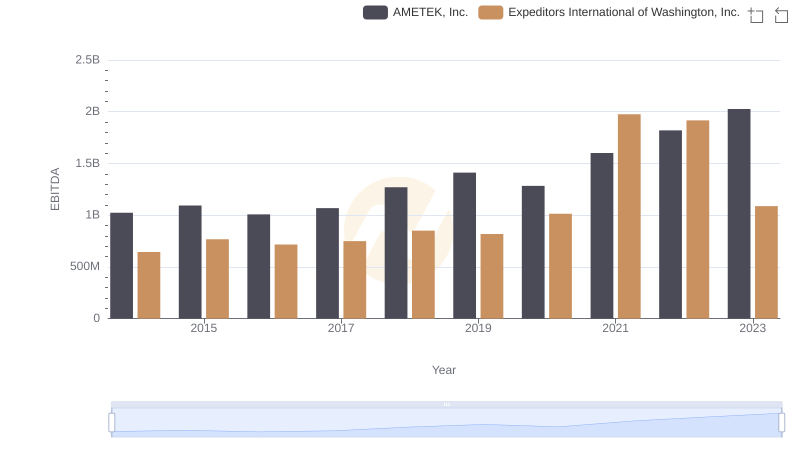
AMETEK, Inc. and Expeditors International of Washington, Inc.: A Detailed Examination of EBITDA Performance