| __timestamp | AMETEK, Inc. | Carlisle Companies Incorporated |
|---|---|---|
| Wednesday, January 1, 2014 | 1424947000 | 819500000 |
| Thursday, January 1, 2015 | 1425015000 | 1006700000 |
| Friday, January 1, 2016 | 1264867000 | 1157300000 |
| Sunday, January 1, 2017 | 1448739000 | 1148000000 |
| Monday, January 1, 2018 | 1659562000 | 1174700000 |
| Tuesday, January 1, 2019 | 1787660000 | 1371700000 |
| Wednesday, January 1, 2020 | 1543514000 | 1137400000 |
| Friday, January 1, 2021 | 1912614000 | 1314700000 |
| Saturday, January 1, 2022 | 2145269000 | 2157400000 |
| Sunday, January 1, 2023 | 2384465001 | 1544000000 |
| Monday, January 1, 2024 | 6941180000 | 1887700000 |
Unleashing the power of data
In the ever-evolving landscape of industrial manufacturing, AMETEK, Inc. and Carlisle Companies Incorporated have emerged as formidable players. Over the past decade, AMETEK has consistently outperformed Carlisle in terms of gross profit, showcasing a robust growth trajectory. From 2014 to 2023, AMETEK's gross profit surged by approximately 67%, peaking in 2023. In contrast, Carlisle experienced a more modest growth of around 88% during the same period, with a notable spike in 2022.
These trends underscore the dynamic nature of the industrial sector, where strategic decisions and market adaptability define success.
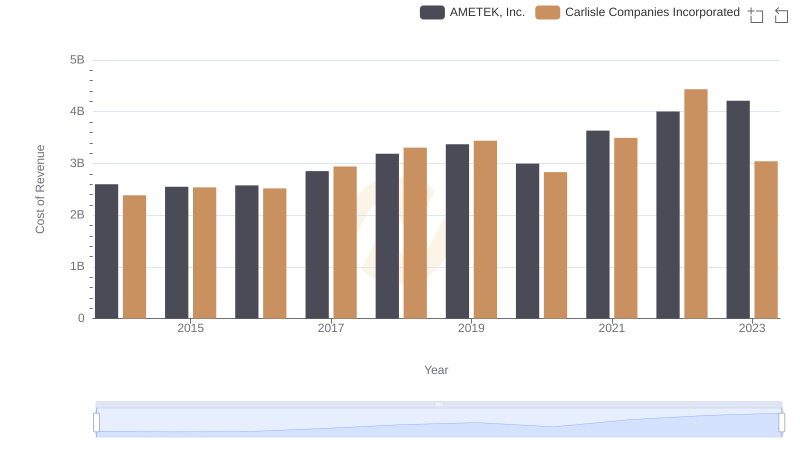
Cost of Revenue Comparison: AMETEK, Inc. vs Carlisle Companies Incorporated
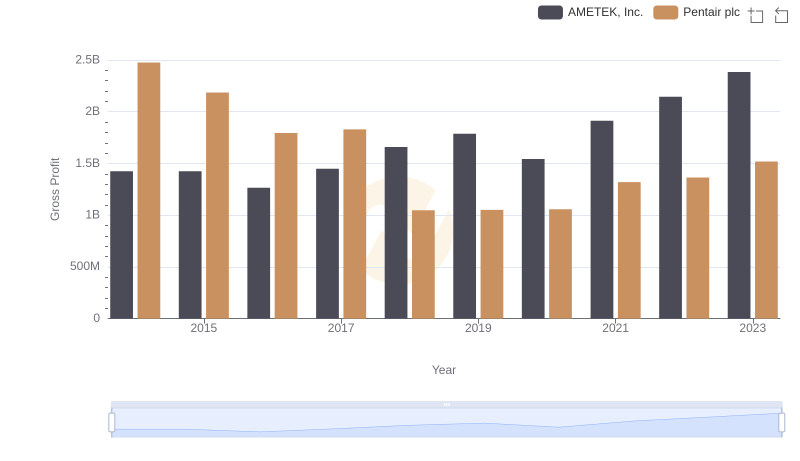
Gross Profit Analysis: Comparing AMETEK, Inc. and Pentair plc
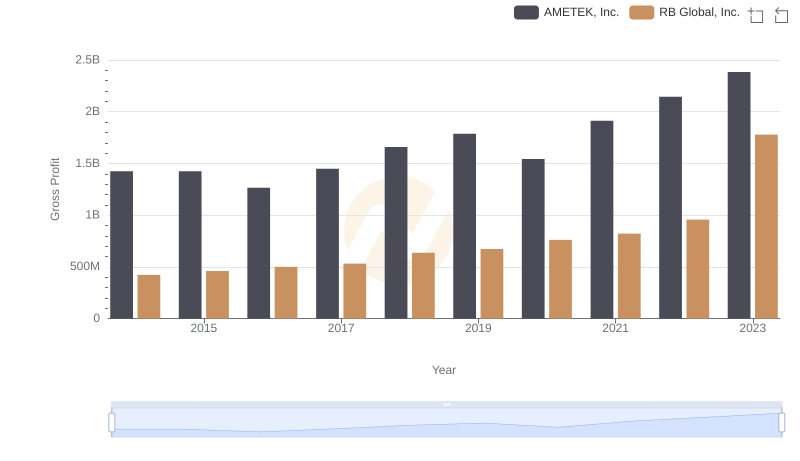
Who Generates Higher Gross Profit? AMETEK, Inc. or RB Global, Inc.
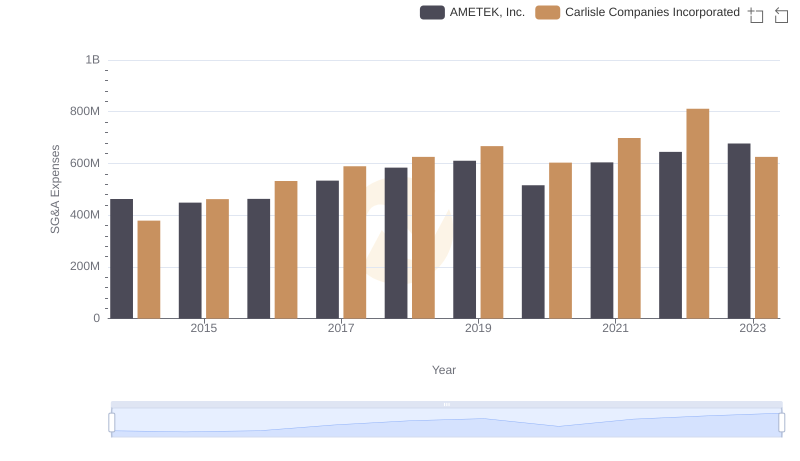
AMETEK, Inc. and Carlisle Companies Incorporated: SG&A Spending Patterns Compared
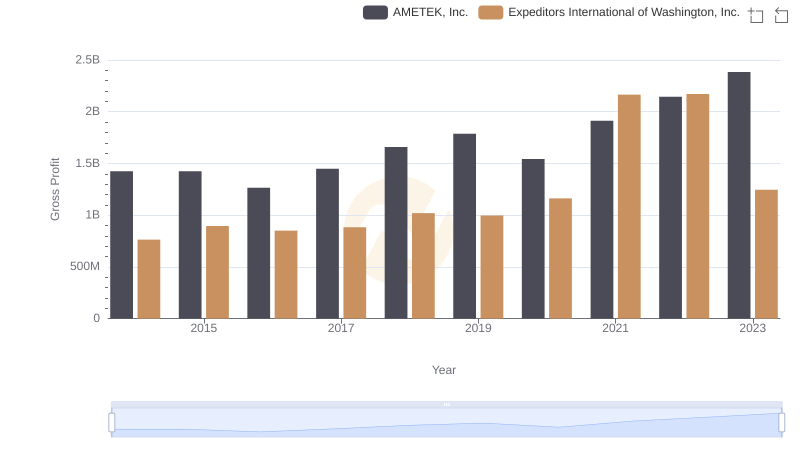
AMETEK, Inc. vs Expeditors International of Washington, Inc.: A Gross Profit Performance Breakdown
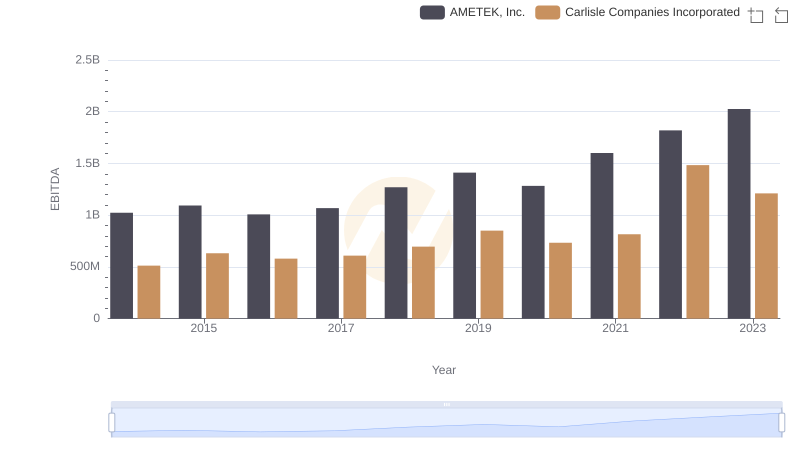
AMETEK, Inc. and Carlisle Companies Incorporated: A Detailed Examination of EBITDA Performance