| __timestamp | AMETEK, Inc. | XPO Logistics, Inc. |
|---|---|---|
| Wednesday, January 1, 2014 | 1424947000 | 381600000 |
| Thursday, January 1, 2015 | 1425015000 | 1084800000 |
| Friday, January 1, 2016 | 1264867000 | 2139300000 |
| Sunday, January 1, 2017 | 1448739000 | 2279700000 |
| Monday, January 1, 2018 | 1659562000 | 2541000000 |
| Tuesday, January 1, 2019 | 1787660000 | 2666000000 |
| Wednesday, January 1, 2020 | 1543514000 | 2563000000 |
| Friday, January 1, 2021 | 1912614000 | 1994000000 |
| Saturday, January 1, 2022 | 2145269000 | 1227000000 |
| Sunday, January 1, 2023 | 2384465001 | 770000000 |
| Monday, January 1, 2024 | 6941180000 | 915000000 |
Infusing magic into the data realm
In the ever-evolving landscape of American industry, AMETEK, Inc. and XPO Logistics, Inc. have emerged as formidable players. Over the past decade, these companies have showcased contrasting trajectories in their gross profit margins. From 2014 to 2023, AMETEK, Inc. demonstrated a steady upward trend, with its gross profit surging by approximately 67%, peaking in 2023. In contrast, XPO Logistics, Inc. experienced a more volatile journey. After a remarkable 600% increase from 2014 to 2019, XPO's profits began to wane, dropping by nearly 71% by 2023. This divergence highlights the resilience and strategic prowess of AMETEK, Inc. in maintaining consistent growth, while XPO Logistics, Inc. faces challenges in sustaining its earlier momentum. As we delve into these trends, the data underscores the dynamic nature of the industrial sector and the importance of adaptability in achieving long-term success.
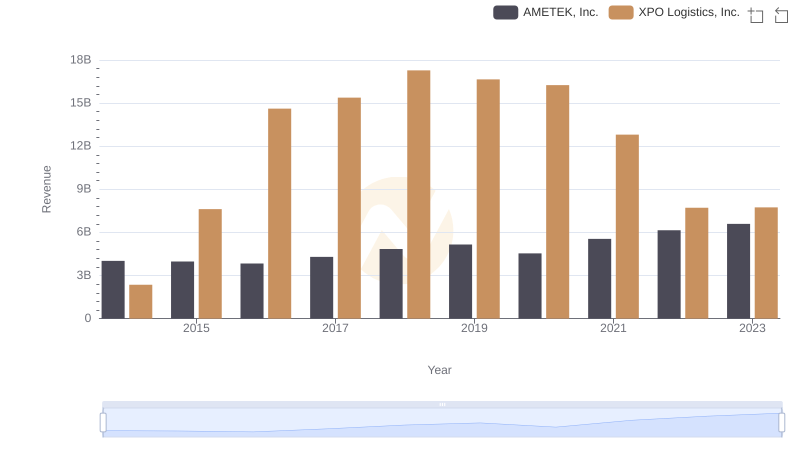
Who Generates More Revenue? AMETEK, Inc. or XPO Logistics, Inc.
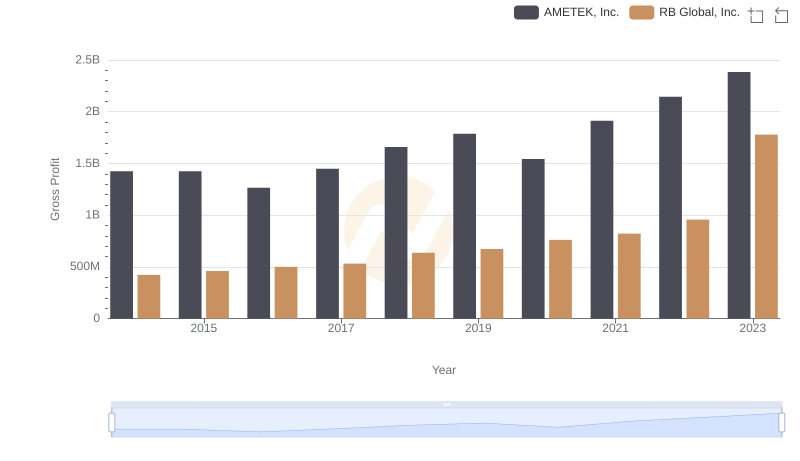
Who Generates Higher Gross Profit? AMETEK, Inc. or RB Global, Inc.
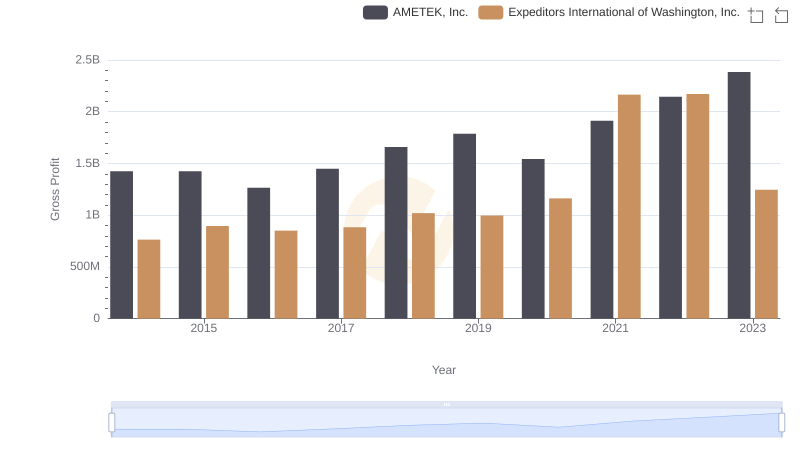
AMETEK, Inc. vs Expeditors International of Washington, Inc.: A Gross Profit Performance Breakdown
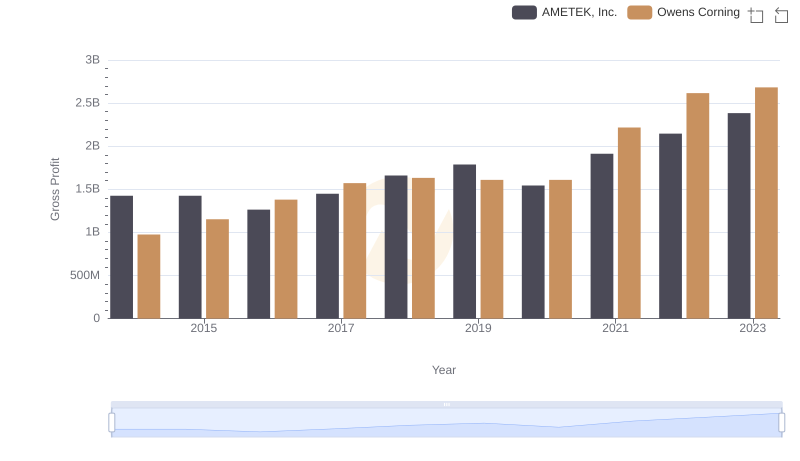
Who Generates Higher Gross Profit? AMETEK, Inc. or Owens Corning
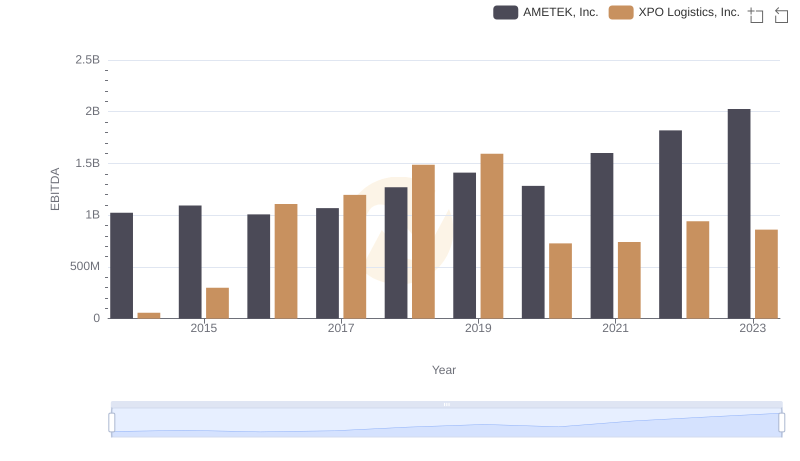
AMETEK, Inc. and XPO Logistics, Inc.: A Detailed Examination of EBITDA Performance