| __timestamp | Graco Inc. | Westinghouse Air Brake Technologies Corporation |
|---|---|---|
| Wednesday, January 1, 2014 | 369321000 | 588370000 |
| Thursday, January 1, 2015 | 346732000 | 672301000 |
| Friday, January 1, 2016 | 354454000 | 535893000 |
| Sunday, January 1, 2017 | 408879000 | 532795000 |
| Monday, January 1, 2018 | 472905000 | 584199000 |
| Tuesday, January 1, 2019 | 466687000 | 1067300000 |
| Wednesday, January 1, 2020 | 440431000 | 1229400000 |
| Friday, January 1, 2021 | 578005000 | 1405000000 |
| Saturday, January 1, 2022 | 641618000 | 1519000000 |
| Sunday, January 1, 2023 | 686593000 | 1787000000 |
| Monday, January 1, 2024 | 570098000 | 1609000000 |
Unveiling the hidden dimensions of data
In the ever-evolving landscape of industrial manufacturing, understanding financial performance is crucial. This analysis delves into the EBITDA trends of two industry giants: Westinghouse Air Brake Technologies Corporation and Graco Inc., from 2014 to 2023. Over this period, Westinghouse Air Brake Technologies showcased a remarkable growth trajectory, with EBITDA increasing by approximately 204%, peaking in 2023. In contrast, Graco Inc. demonstrated a steady yet modest growth of around 86% over the same period. Notably, 2021 marked a significant year for both companies, with Graco Inc. experiencing a 31% surge in EBITDA, while Westinghouse Air Brake Technologies saw a 14% increase. However, data for 2024 remains incomplete, leaving room for speculation on future trends. This comparative analysis highlights the dynamic nature of financial performance in the industrial sector, offering valuable insights for investors and industry enthusiasts alike.
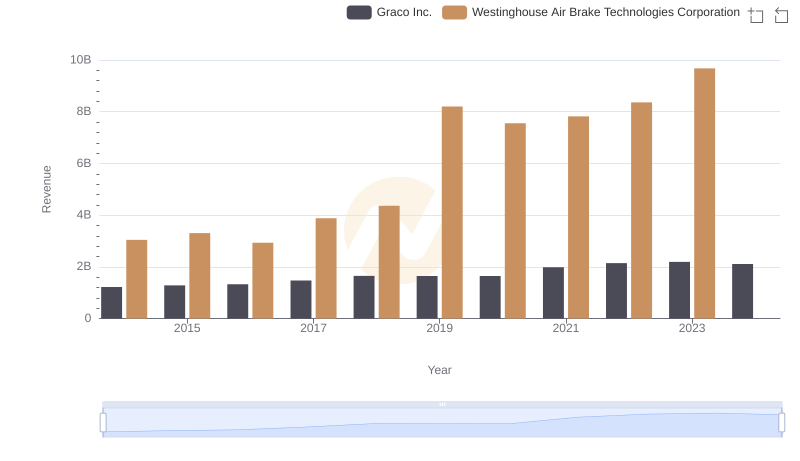
Westinghouse Air Brake Technologies Corporation vs Graco Inc.: Annual Revenue Growth Compared
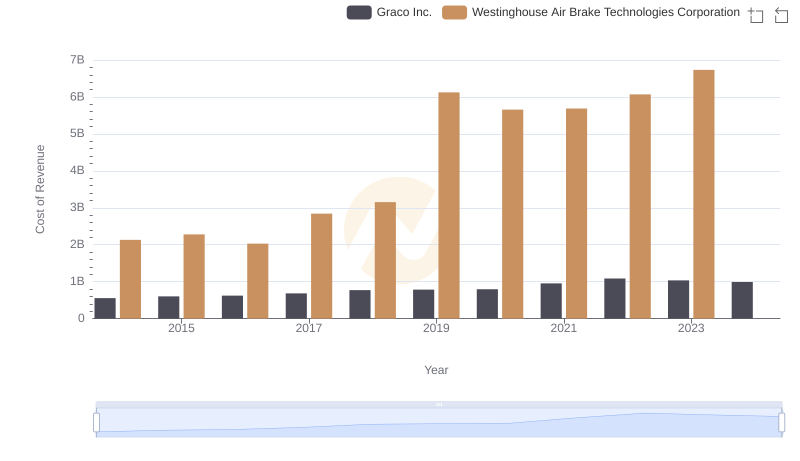
Cost of Revenue: Key Insights for Westinghouse Air Brake Technologies Corporation and Graco Inc.
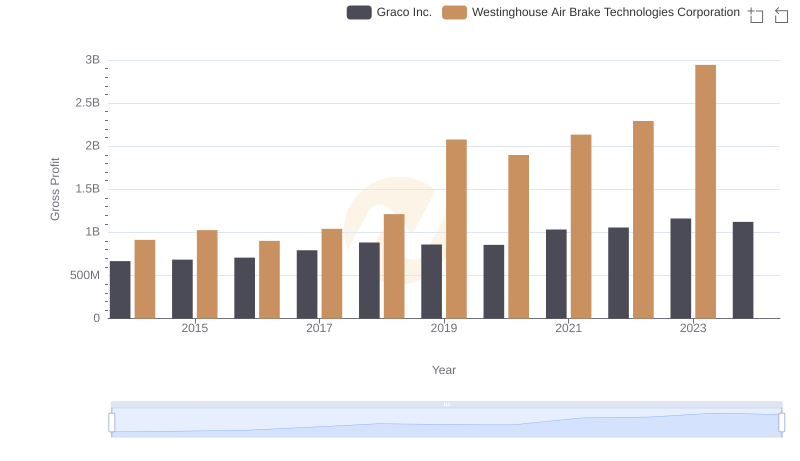
Who Generates Higher Gross Profit? Westinghouse Air Brake Technologies Corporation or Graco Inc.
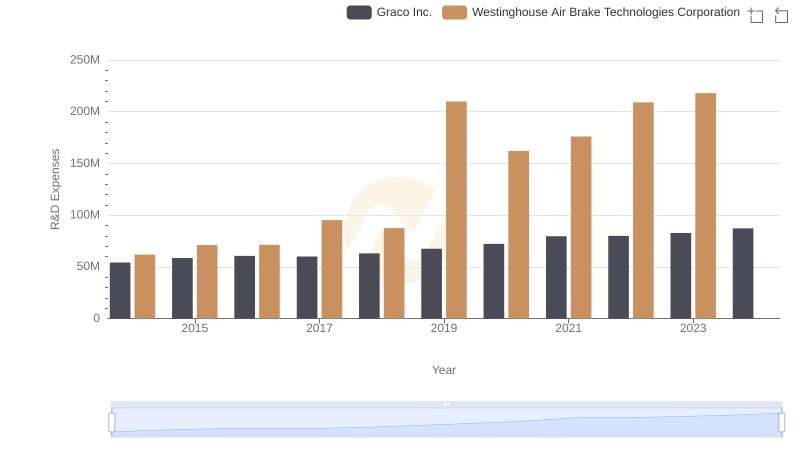
Who Prioritizes Innovation? R&D Spending Compared for Westinghouse Air Brake Technologies Corporation and Graco Inc.
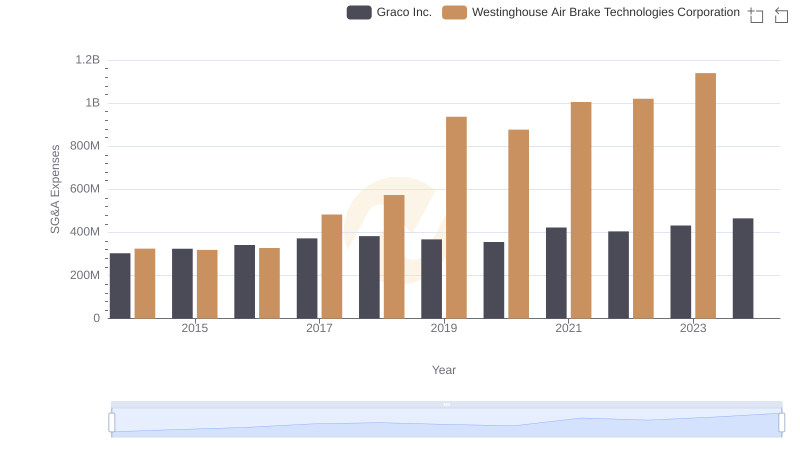
Selling, General, and Administrative Costs: Westinghouse Air Brake Technologies Corporation vs Graco Inc.
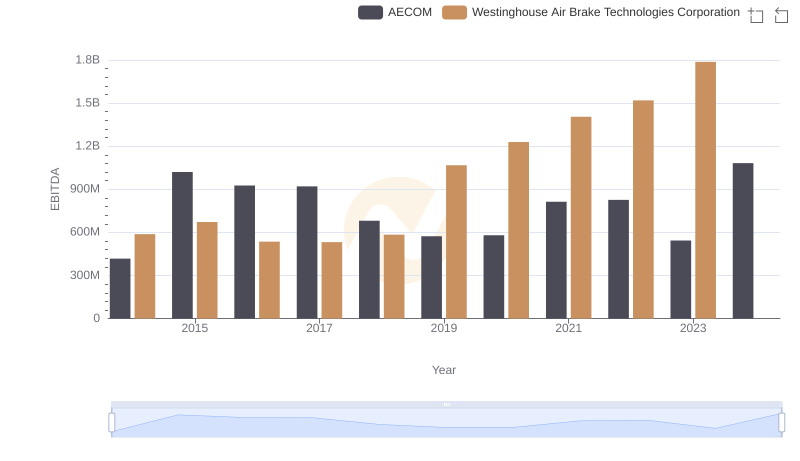
EBITDA Performance Review: Westinghouse Air Brake Technologies Corporation vs AECOM
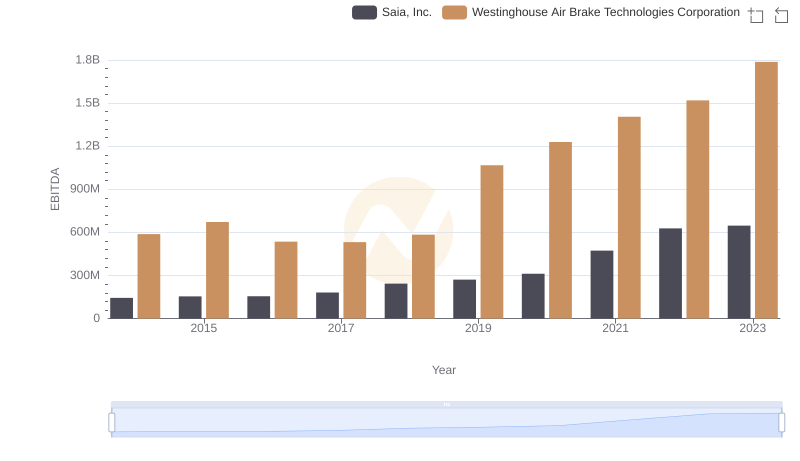
Professional EBITDA Benchmarking: Westinghouse Air Brake Technologies Corporation vs Saia, Inc.
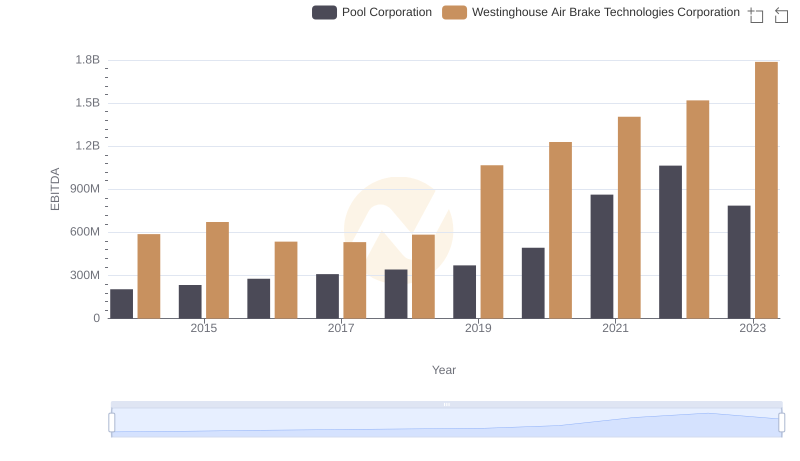
Westinghouse Air Brake Technologies Corporation vs Pool Corporation: In-Depth EBITDA Performance Comparison
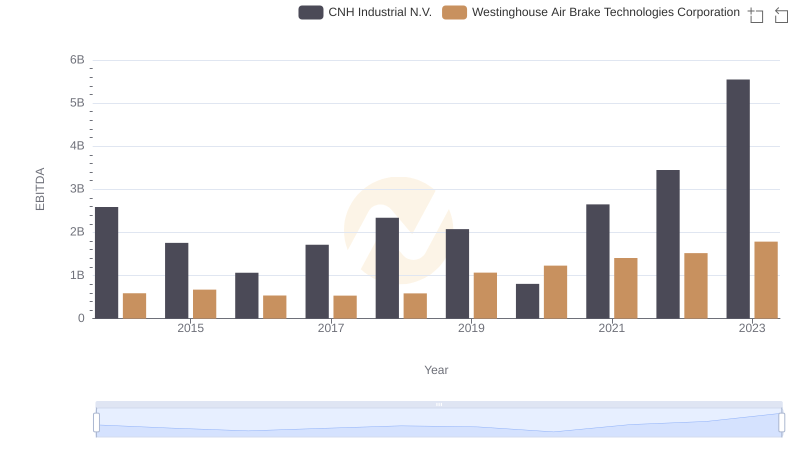
Westinghouse Air Brake Technologies Corporation and CNH Industrial N.V.: A Detailed Examination of EBITDA Performance
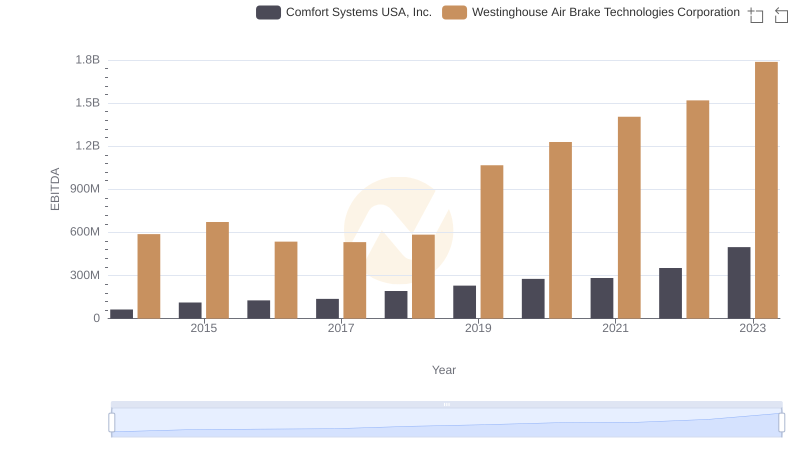
Westinghouse Air Brake Technologies Corporation vs Comfort Systems USA, Inc.: In-Depth EBITDA Performance Comparison
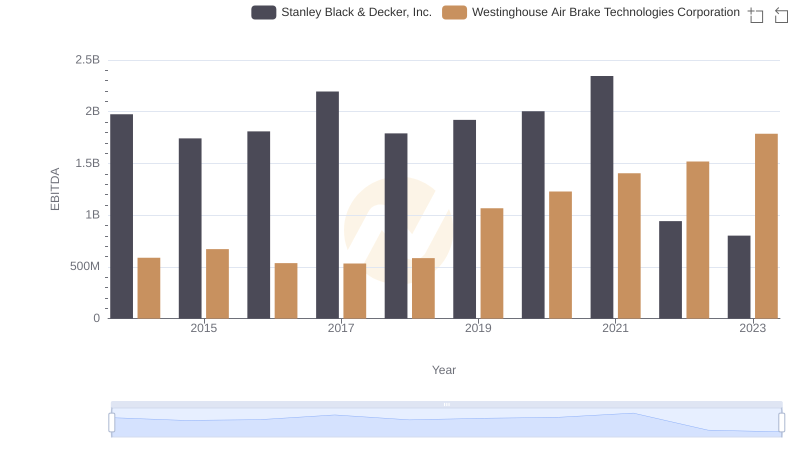
Westinghouse Air Brake Technologies Corporation and Stanley Black & Decker, Inc.: A Detailed Examination of EBITDA Performance
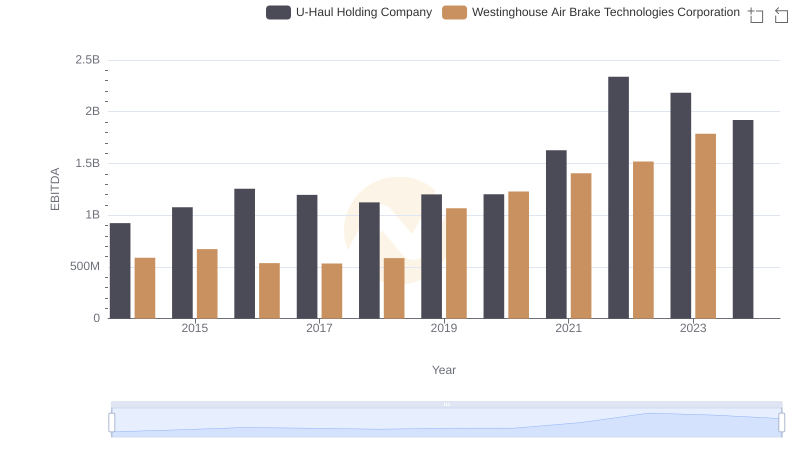
A Side-by-Side Analysis of EBITDA: Westinghouse Air Brake Technologies Corporation and U-Haul Holding Company