| __timestamp | Stanley Black & Decker, Inc. | Westinghouse Air Brake Technologies Corporation |
|---|---|---|
| Wednesday, January 1, 2014 | 1975400000 | 588370000 |
| Thursday, January 1, 2015 | 1741900000 | 672301000 |
| Friday, January 1, 2016 | 1810200000 | 535893000 |
| Sunday, January 1, 2017 | 2196000000 | 532795000 |
| Monday, January 1, 2018 | 1791200000 | 584199000 |
| Tuesday, January 1, 2019 | 1920600000 | 1067300000 |
| Wednesday, January 1, 2020 | 2004200000 | 1229400000 |
| Friday, January 1, 2021 | 2345500000 | 1405000000 |
| Saturday, January 1, 2022 | 942800000 | 1519000000 |
| Sunday, January 1, 2023 | 802700000 | 1787000000 |
| Monday, January 1, 2024 | 286300000 | 1609000000 |
Unveiling the hidden dimensions of data
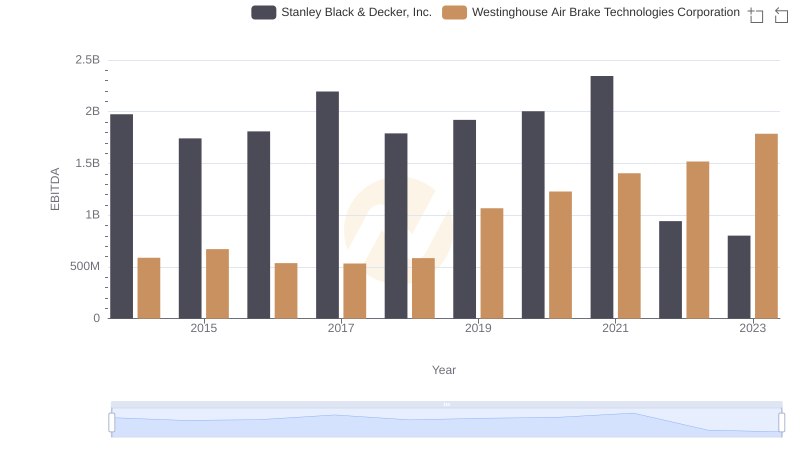
In the realm of corporate finance, EBITDA (Earnings Before Interest, Taxes, Depreciation, and Amortization) serves as a vital indicator of a company's operational performance. It provides a clear picture of profitability, allowing investors and stakeholders to gauge the financial health of a business without the noise of non-operational factors. This analysis delves into the EBITDA performance of two prominent companies: Westinghouse Air Brake Technologies Corporation and Stanley Black & Decker, Inc., over a decade from 2014 to 2023.
Both companies have established a significant presence in their respective industries. Stanley Black & Decker, a leader in tools and security solutions, has consistently demonstrated robust financial growth. In contrast, Westinghouse Air Brake Technologies, known for its innovative transportation solutions, has shown a steady increase in its EBITDA, albeit at a different pace.
From 2014 to 2023, Stanley Black & Decker's EBITDA has fluctuated, peaking impressively at approximately $2.35 billion in 2021, a staggering 18% increase from the previous year. This growth trajectory highlights the company's resilience and adaptability in a competitive market. However, 2022 saw a notable decline of about 60%, dropping to $942 million, before recovering slightly in 2023 to $802 million.
On the other hand, Westinghouse Air Brake Technologies has maintained a more stable EBITDA performance. Starting at around $588 million in 2014, the company experienced gradual growth, reaching a high of approximately $1.79 billion by 2023. This steady increase reflects a 203% growth over the decade, showcasing its ability to capitalize on market opportunities and enhance operational efficiencies.
Examining the yearly performance reveals intriguing patterns. In 2016, Stanley Black & Decker recorded an EBITDA of $1.81 billion, while Westinghouse reported $536 million. The following year, both companies experienced a slight dip, but Stanley Black & Decker rebounded strongly, achieving its peak in 2021. Conversely, Westinghouse's growth has been more consistent, with a remarkable increase from $1.07 billion in 2019 to $1.23 billion in 2020, indicating a 15% growth in a challenging economic environment.
The comparative analysis of EBITDA performance between Westinghouse Air Brake Technologies and Stanley Black & Decker reveals distinct narratives. While Stanley Black & Decker exhibits significant peaks and valleys, Westinghouse showcases a steady upward trajectory. For investors and analysts, understanding these trends is crucial for making informed decisions. As both companies continue to navigate the complexities of their industries, their ability to adapt and innovate will undoubtedly shape their future financial landscapes. This analysis underscores the importance of EBITDA as a key performance metric, providing valuable insights into the operational efficiency and profitability of these leading firms.
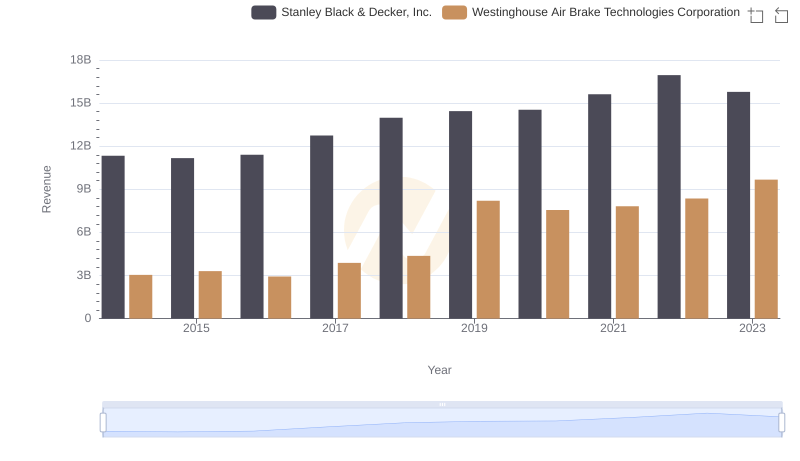
Westinghouse Air Brake Technologies Corporation vs Stanley Black & Decker, Inc.: Examining Key Revenue Metrics
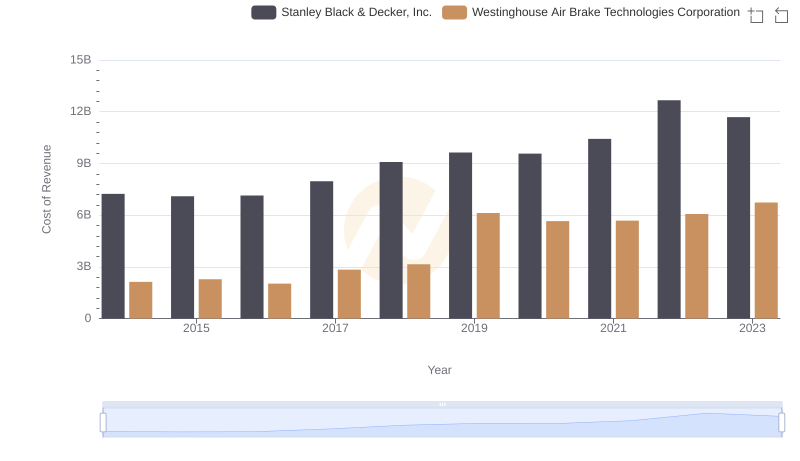
Cost of Revenue Trends: Westinghouse Air Brake Technologies Corporation vs Stanley Black & Decker, Inc.
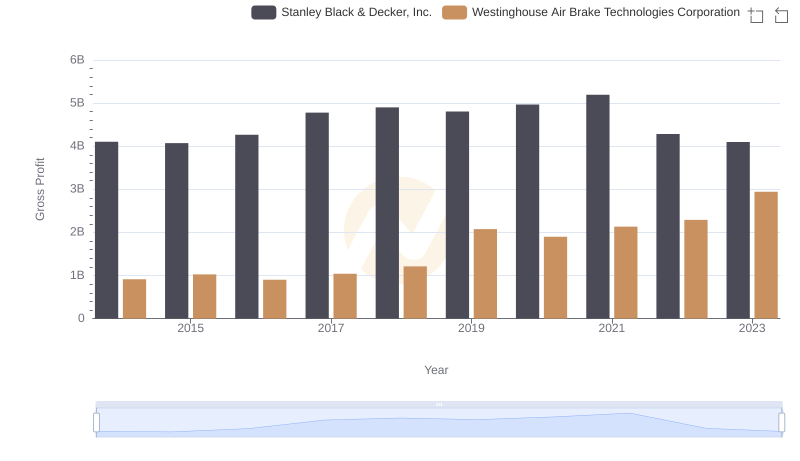
Who Generates Higher Gross Profit? Westinghouse Air Brake Technologies Corporation or Stanley Black & Decker, Inc.

Comparing Innovation Spending: Westinghouse Air Brake Technologies Corporation and Stanley Black & Decker, Inc.
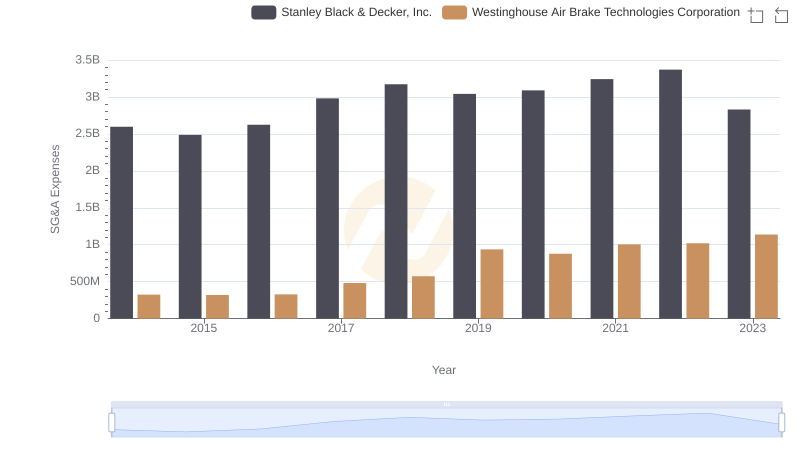
Who Optimizes SG&A Costs Better? Westinghouse Air Brake Technologies Corporation or Stanley Black & Decker, Inc.
Comparative EBITDA Analysis: Westinghouse Air Brake Technologies Corporation vs Stanley Black & Decker, Inc.

Breaking Down Revenue Trends: Westinghouse Air Brake Technologies Corporation vs Stanley Black & Decker, Inc.

Cost of Revenue Comparison: Westinghouse Air Brake Technologies Corporation vs Stanley Black & Decker, Inc.

Who Generates Higher Gross Profit? Westinghouse Air Brake Technologies Corporation or Stanley Black & Decker, Inc.
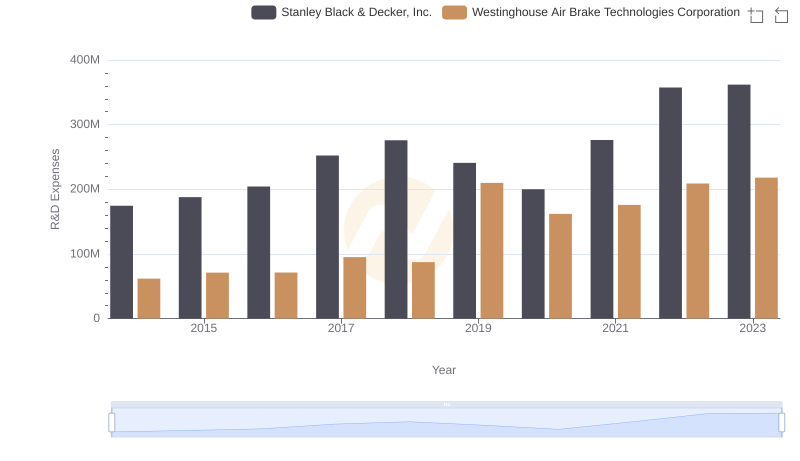
Westinghouse Air Brake Technologies Corporation vs Stanley Black & Decker, Inc.: Strategic Focus on R&D Spending

Selling, General, and Administrative Costs: Westinghouse Air Brake Technologies Corporation vs Stanley Black & Decker, Inc.
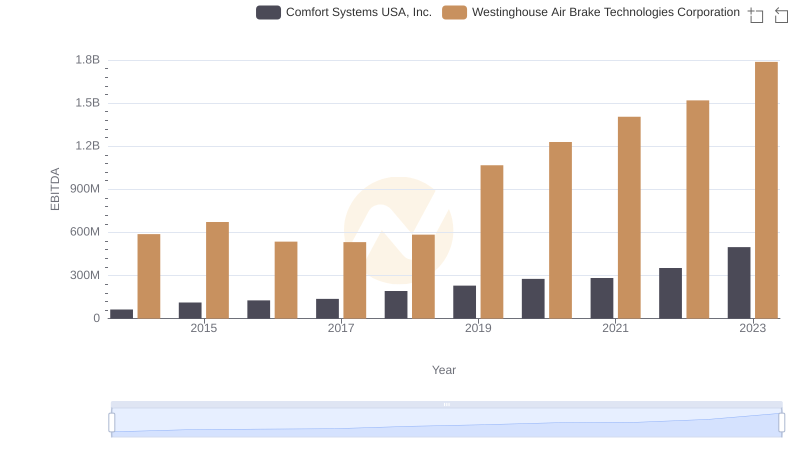
Westinghouse Air Brake Technologies Corporation vs Comfort Systems USA, Inc.: In-Depth EBITDA Performance Comparison