| __timestamp | Graco Inc. | Westinghouse Air Brake Technologies Corporation |
|---|---|---|
| Wednesday, January 1, 2014 | 1221130000 | 3044454000 |
| Thursday, January 1, 2015 | 1286485000 | 3307998000 |
| Friday, January 1, 2016 | 1329293000 | 2931188000 |
| Sunday, January 1, 2017 | 1474744000 | 3881756000 |
| Monday, January 1, 2018 | 1653292000 | 4363547000 |
| Tuesday, January 1, 2019 | 1646045000 | 8200000000 |
| Wednesday, January 1, 2020 | 1650115000 | 7556100000 |
| Friday, January 1, 2021 | 1987608000 | 7822000000 |
| Saturday, January 1, 2022 | 2143521000 | 8362000000 |
| Sunday, January 1, 2023 | 2195606000 | 9677000000 |
| Monday, January 1, 2024 | 2113316000 | 10387000000 |
Unleashing insights
In the ever-evolving landscape of industrial manufacturing, revenue growth is a key indicator of a company's success. Over the past decade, Westinghouse Air Brake Technologies Corporation and Graco Inc. have demonstrated contrasting trajectories in their annual revenue growth.
From 2014 to 2023, Westinghouse Air Brake Technologies Corporation saw its revenue soar by over 200%, peaking at approximately $9.7 billion in 2023. This remarkable growth underscores the company's strategic expansions and market adaptability. In contrast, Graco Inc. experienced a steady yet modest increase of around 80% during the same period, reaching a revenue of about $2.2 billion in 2023.
While Westinghouse's aggressive growth strategy has paid off, Graco's consistent performance highlights its stability in the market. The data for 2024 remains incomplete, leaving room for speculation on future trends.
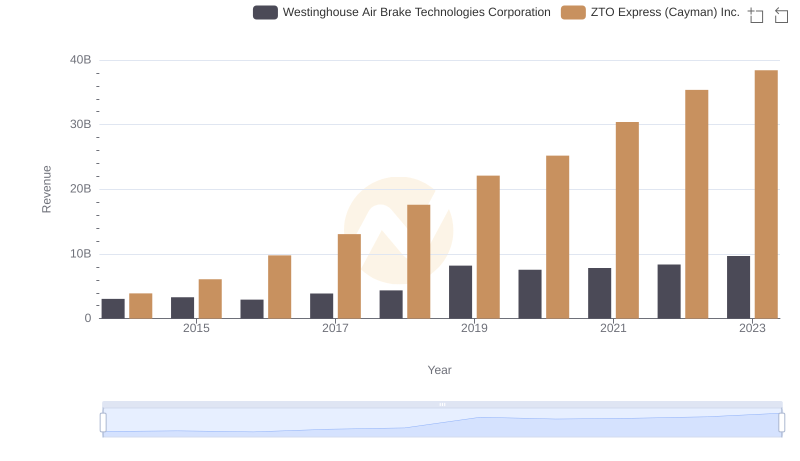
Who Generates More Revenue? Westinghouse Air Brake Technologies Corporation or ZTO Express (Cayman) Inc.
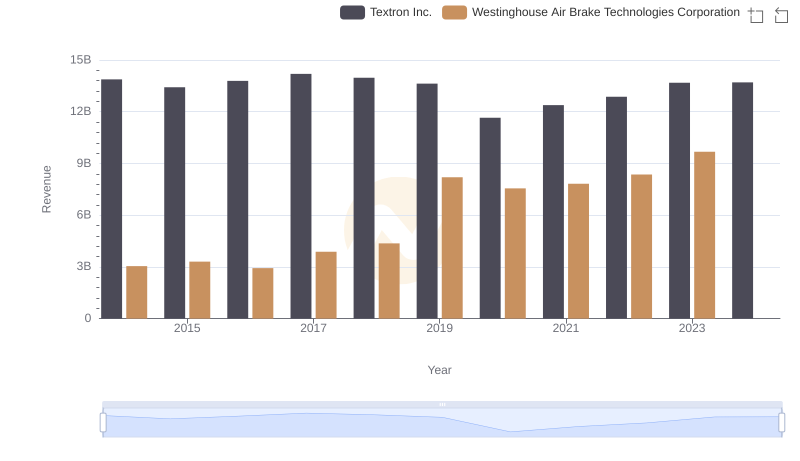
Westinghouse Air Brake Technologies Corporation or Textron Inc.: Who Leads in Yearly Revenue?

Revenue Insights: Westinghouse Air Brake Technologies Corporation and CNH Industrial N.V. Performance Compared
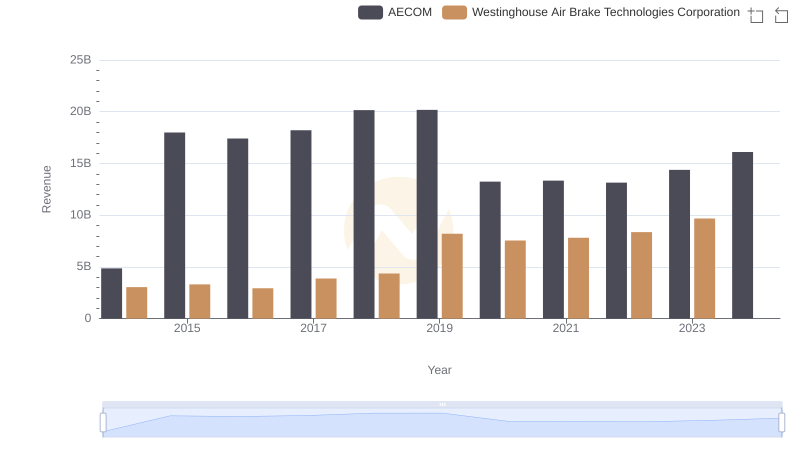
Westinghouse Air Brake Technologies Corporation vs AECOM: Annual Revenue Growth Compared
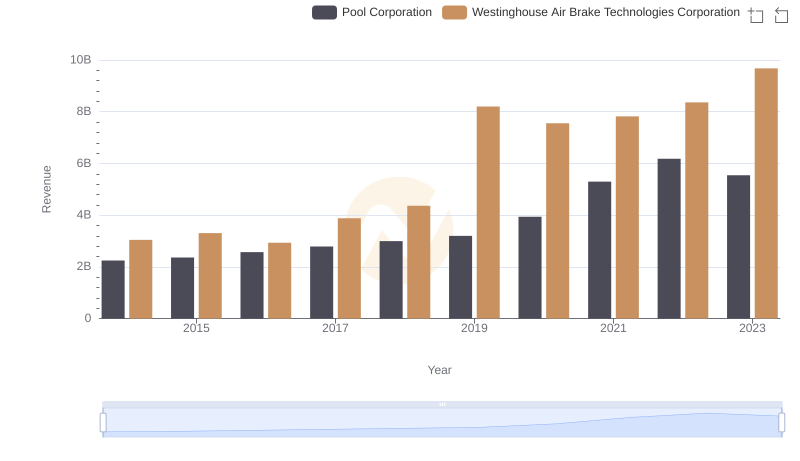
Westinghouse Air Brake Technologies Corporation and Pool Corporation: A Comprehensive Revenue Analysis
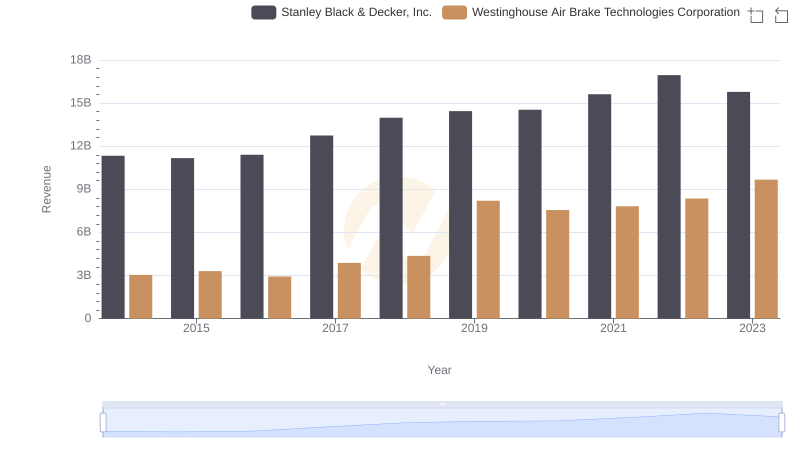
Breaking Down Revenue Trends: Westinghouse Air Brake Technologies Corporation vs Stanley Black & Decker, Inc.

Westinghouse Air Brake Technologies Corporation and Saia, Inc.: A Comprehensive Revenue Analysis
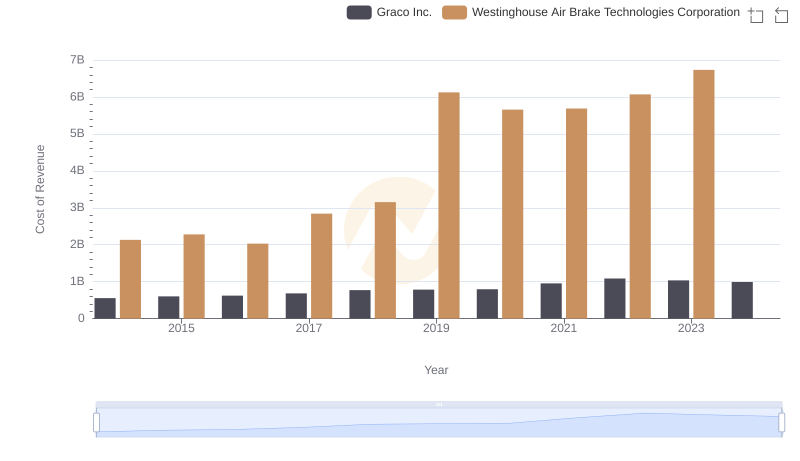
Cost of Revenue: Key Insights for Westinghouse Air Brake Technologies Corporation and Graco Inc.
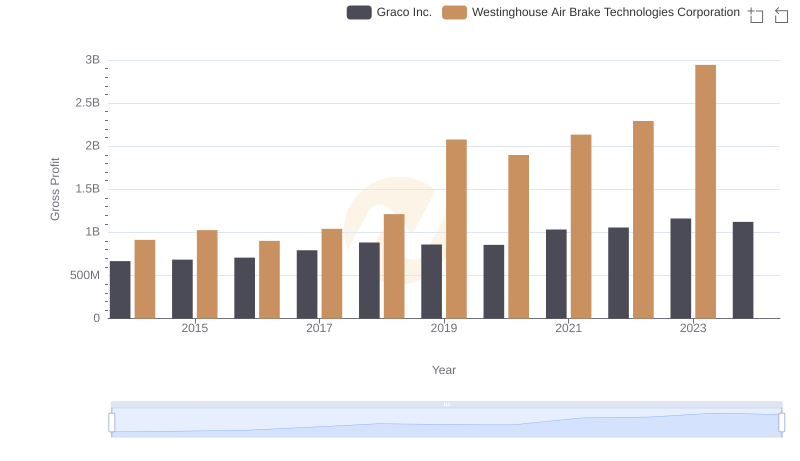
Who Generates Higher Gross Profit? Westinghouse Air Brake Technologies Corporation or Graco Inc.
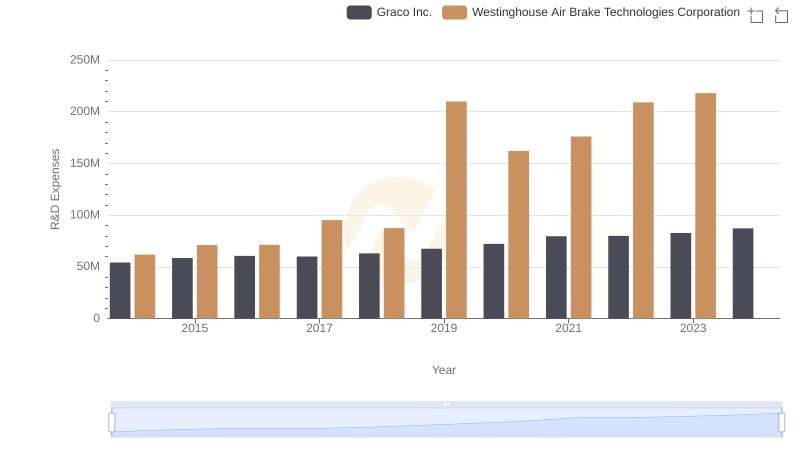
Who Prioritizes Innovation? R&D Spending Compared for Westinghouse Air Brake Technologies Corporation and Graco Inc.
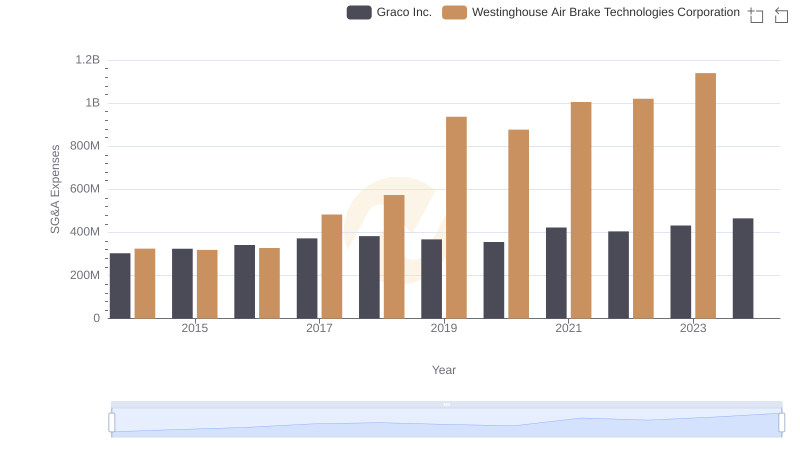
Selling, General, and Administrative Costs: Westinghouse Air Brake Technologies Corporation vs Graco Inc.
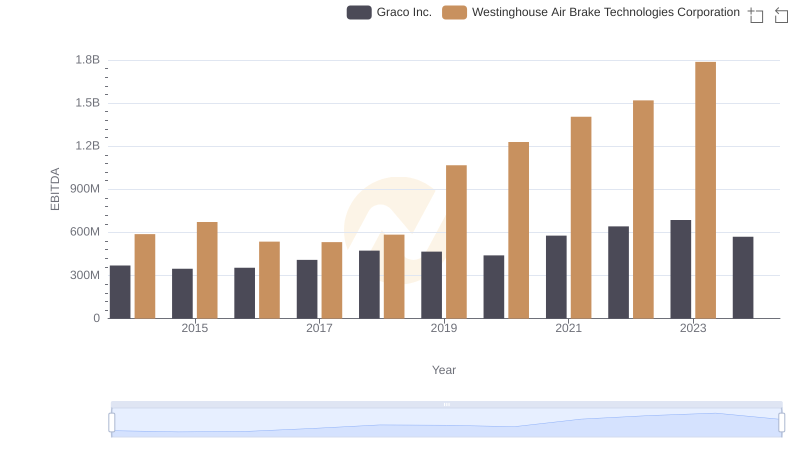
Westinghouse Air Brake Technologies Corporation and Graco Inc.: A Detailed Examination of EBITDA Performance