| __timestamp | Owens Corning | Watsco, Inc. |
|---|---|---|
| Wednesday, January 1, 2014 | 487000000 | 650655000 |
| Thursday, January 1, 2015 | 525000000 | 670609000 |
| Friday, January 1, 2016 | 584000000 | 688952000 |
| Sunday, January 1, 2017 | 620000000 | 715671000 |
| Monday, January 1, 2018 | 700000000 | 757452000 |
| Tuesday, January 1, 2019 | 698000000 | 800328000 |
| Wednesday, January 1, 2020 | 664000000 | 833051000 |
| Friday, January 1, 2021 | 757000000 | 1058316000 |
| Saturday, January 1, 2022 | 803000000 | 1221382000 |
| Sunday, January 1, 2023 | 831000000 | 1185626000 |
| Monday, January 1, 2024 | 1262938000 |
Unleashing the power of data
In the ever-evolving landscape of corporate finance, understanding the nuances of Selling, General, and Administrative (SG&A) expenses is crucial. Over the past decade, Watsco, Inc. and Owens Corning have demonstrated distinct trajectories in their SG&A expenditures. From 2014 to 2023, Watsco, Inc. consistently outpaced Owens Corning, with a notable 82% increase in SG&A expenses, peaking at approximately $1.22 billion in 2022. In contrast, Owens Corning's expenses grew by 71%, reaching around $831 million in 2023. This trend highlights Watsco's aggressive expansion and operational scaling, while Owens Corning maintains a steady growth path. As businesses navigate the complexities of cost management, these insights offer a window into strategic financial planning and resource allocation. Dive deeper into the data to explore how these industry giants manage their operational costs and what it means for their future growth.
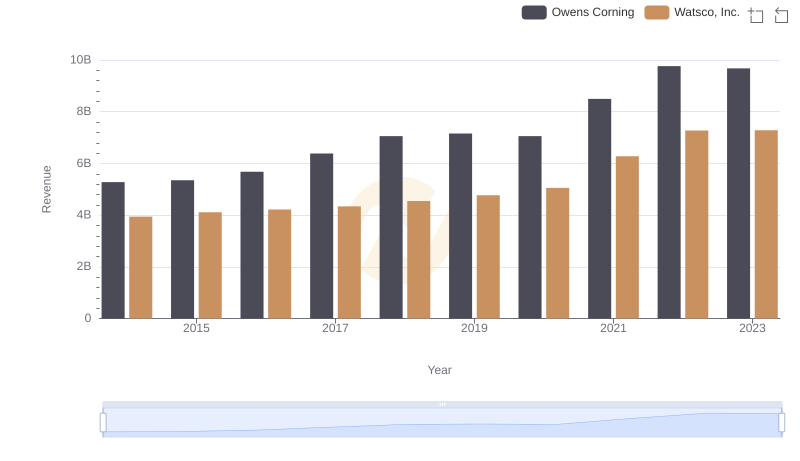
Watsco, Inc. vs Owens Corning: Annual Revenue Growth Compared
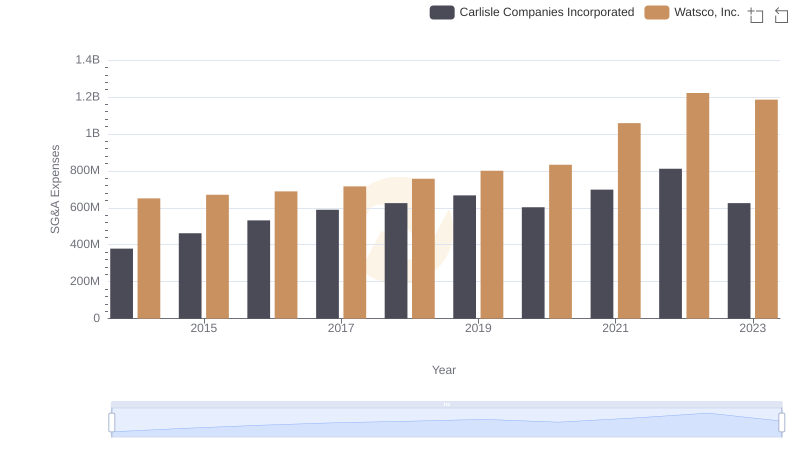
Watsco, Inc. and Carlisle Companies Incorporated: SG&A Spending Patterns Compared
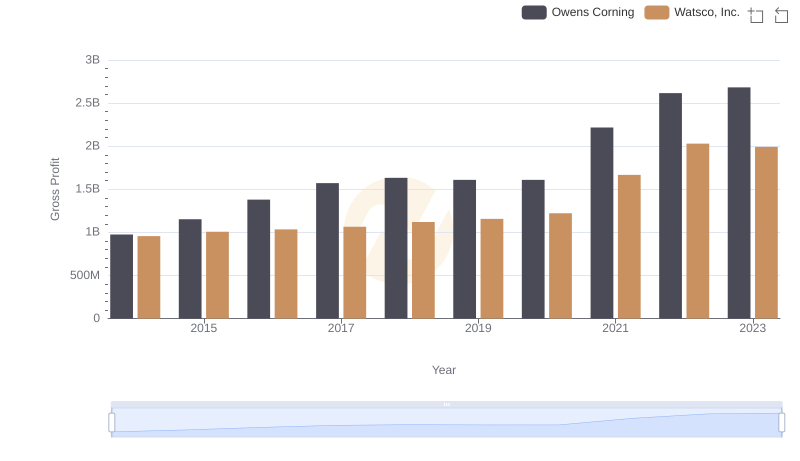
Gross Profit Trends Compared: Watsco, Inc. vs Owens Corning
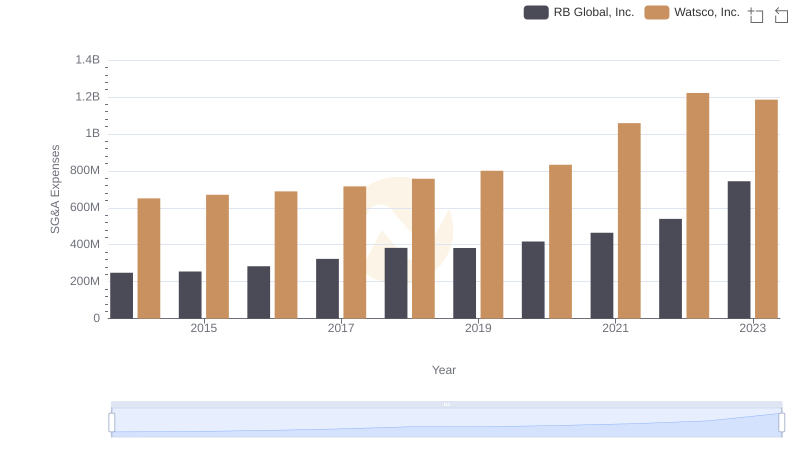
Selling, General, and Administrative Costs: Watsco, Inc. vs RB Global, Inc.
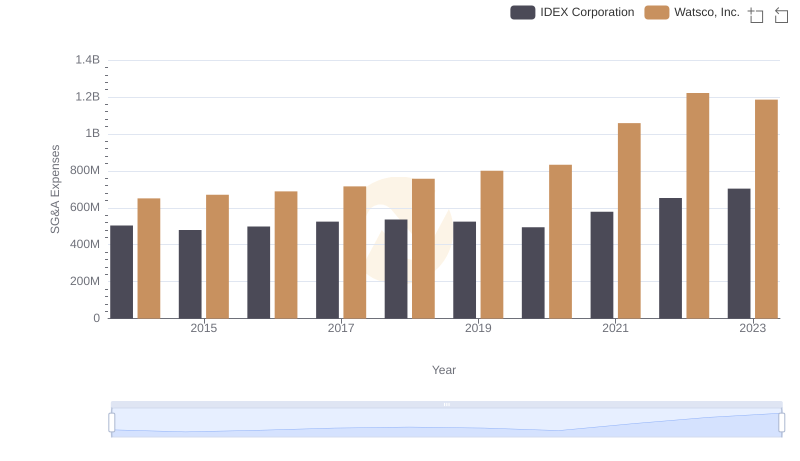
Comparing SG&A Expenses: Watsco, Inc. vs IDEX Corporation Trends and Insights
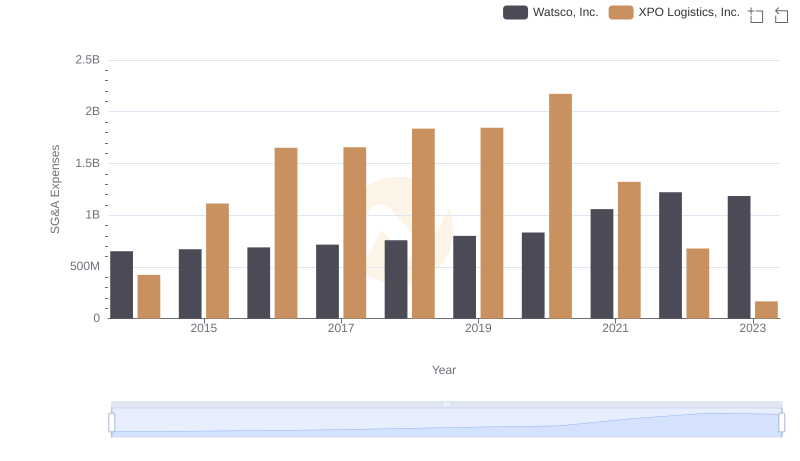
Breaking Down SG&A Expenses: Watsco, Inc. vs XPO Logistics, Inc.
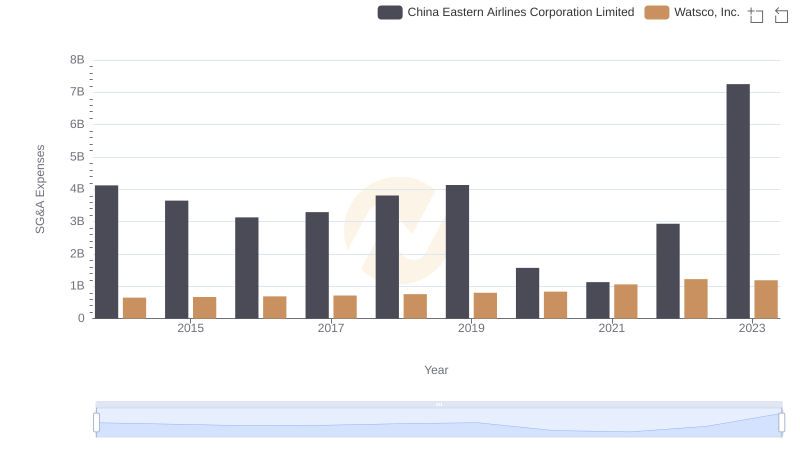
Cost Management Insights: SG&A Expenses for Watsco, Inc. and China Eastern Airlines Corporation Limited
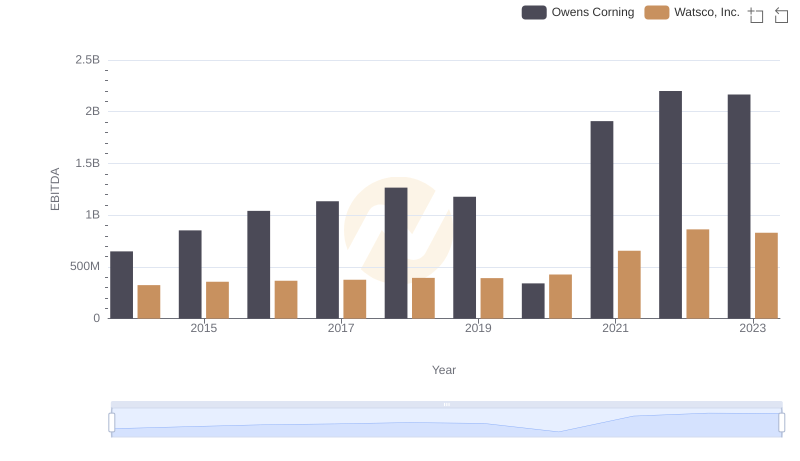
EBITDA Analysis: Evaluating Watsco, Inc. Against Owens Corning
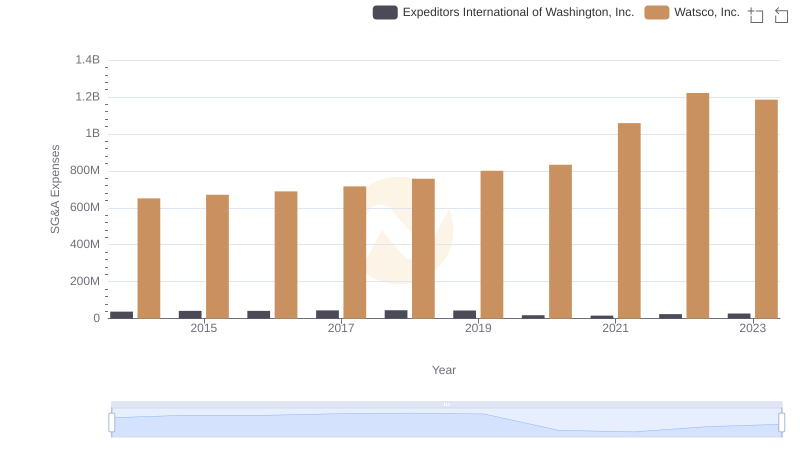
SG&A Efficiency Analysis: Comparing Watsco, Inc. and Expeditors International of Washington, Inc.