| __timestamp | RB Global, Inc. | Watsco, Inc. |
|---|---|---|
| Wednesday, January 1, 2014 | 248220000 | 650655000 |
| Thursday, January 1, 2015 | 254990000 | 670609000 |
| Friday, January 1, 2016 | 283529000 | 688952000 |
| Sunday, January 1, 2017 | 323270000 | 715671000 |
| Monday, January 1, 2018 | 382676000 | 757452000 |
| Tuesday, January 1, 2019 | 382389000 | 800328000 |
| Wednesday, January 1, 2020 | 417523000 | 833051000 |
| Friday, January 1, 2021 | 464599000 | 1058316000 |
| Saturday, January 1, 2022 | 539933000 | 1221382000 |
| Sunday, January 1, 2023 | 743700000 | 1185626000 |
| Monday, January 1, 2024 | 773900000 | 1262938000 |
In pursuit of knowledge
In the ever-evolving landscape of corporate finance, Selling, General, and Administrative (SG&A) expenses serve as a critical indicator of a company's operational efficiency. Over the past decade, Watsco, Inc. and RB Global, Inc. have demonstrated contrasting trajectories in their SG&A expenditures.
From 2014 to 2023, Watsco, Inc. consistently outpaced RB Global, Inc. in SG&A costs, peaking at approximately $1.22 billion in 2022. This represents a 88% increase from 2014. Meanwhile, RB Global, Inc. saw a significant rise of 200% in their SG&A expenses, reaching around $743 million in 2023.
These trends highlight the strategic choices each company has made in managing their operational costs. As businesses navigate the complexities of the modern market, understanding these financial dynamics is crucial for investors and stakeholders alike.
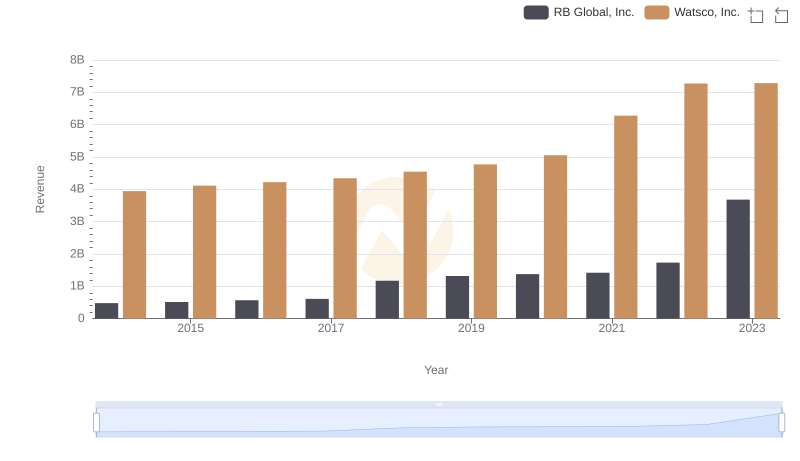
Breaking Down Revenue Trends: Watsco, Inc. vs RB Global, Inc.
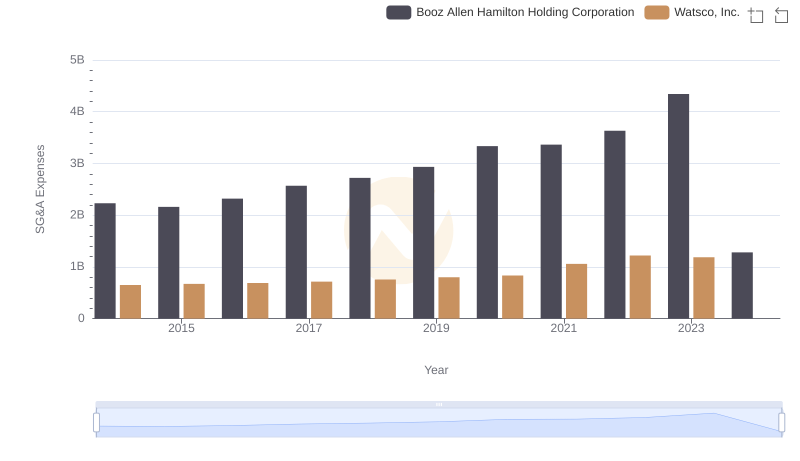
Comparing SG&A Expenses: Watsco, Inc. vs Booz Allen Hamilton Holding Corporation Trends and Insights
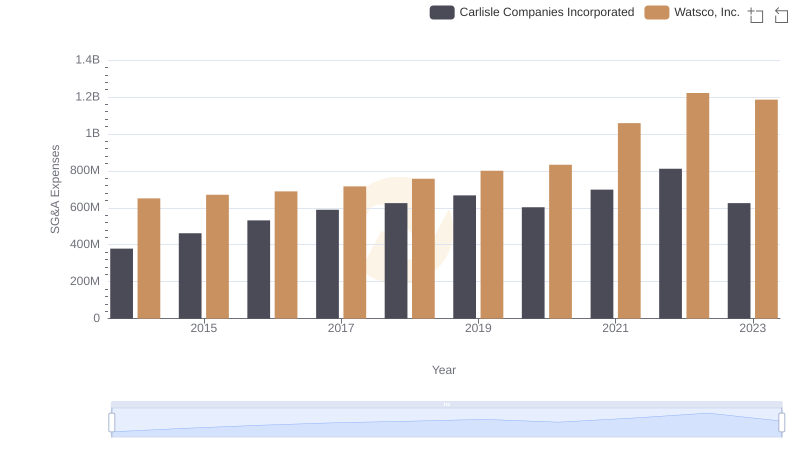
Watsco, Inc. and Carlisle Companies Incorporated: SG&A Spending Patterns Compared
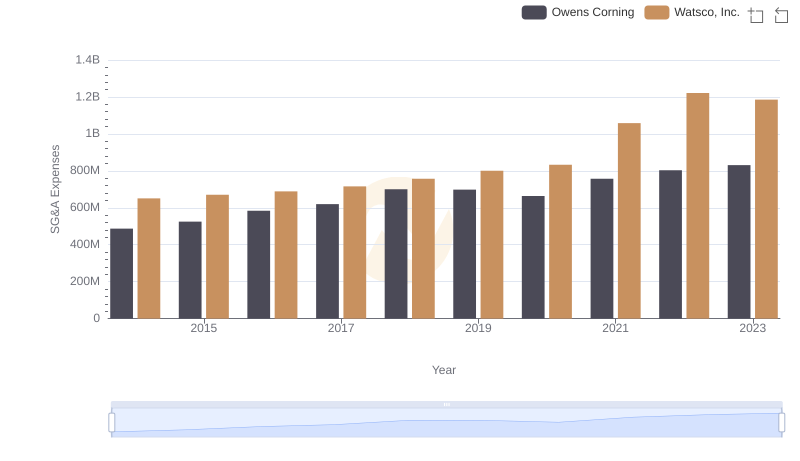
Selling, General, and Administrative Costs: Watsco, Inc. vs Owens Corning
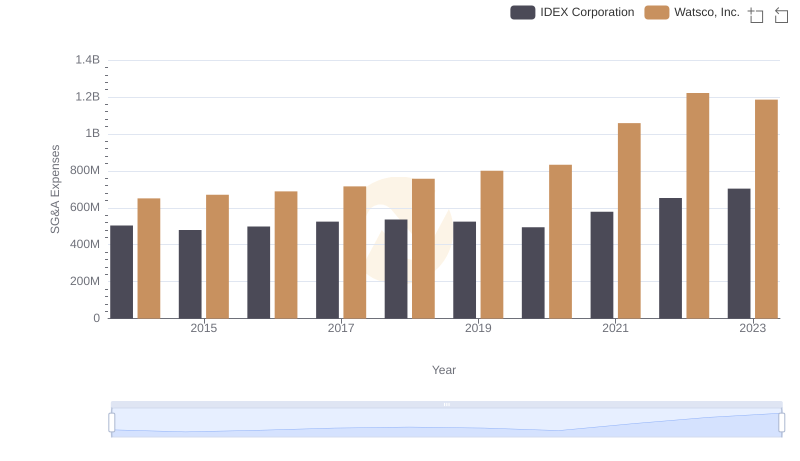
Comparing SG&A Expenses: Watsco, Inc. vs IDEX Corporation Trends and Insights
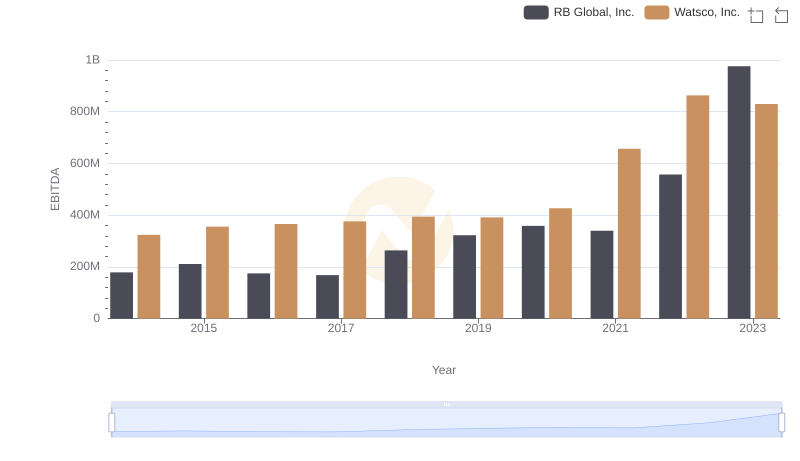
Comprehensive EBITDA Comparison: Watsco, Inc. vs RB Global, Inc.
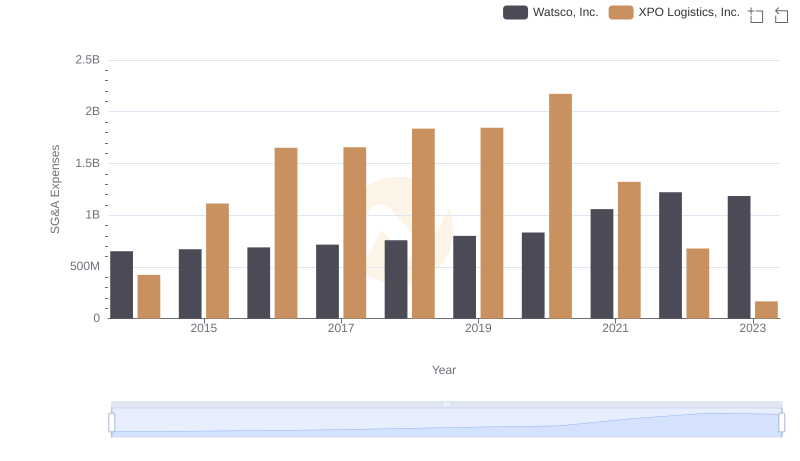
Breaking Down SG&A Expenses: Watsco, Inc. vs XPO Logistics, Inc.
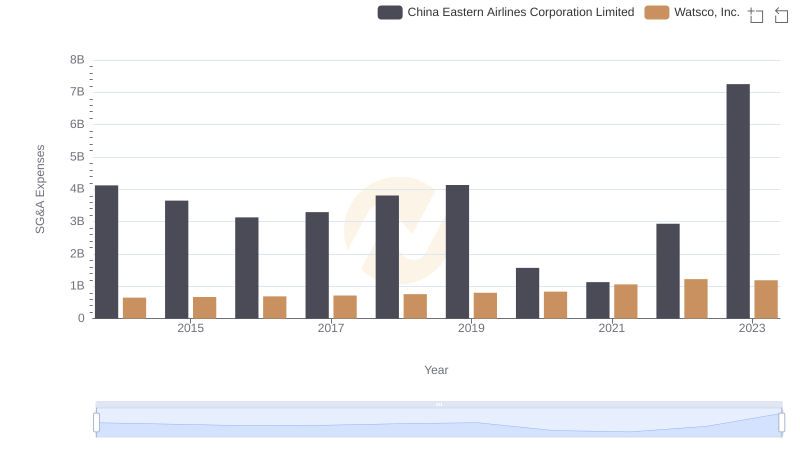
Cost Management Insights: SG&A Expenses for Watsco, Inc. and China Eastern Airlines Corporation Limited