| __timestamp | IDEX Corporation | Watsco, Inc. |
|---|---|---|
| Wednesday, January 1, 2014 | 504019000 | 323674000 |
| Thursday, January 1, 2015 | 505071000 | 355865000 |
| Friday, January 1, 2016 | 507871000 | 365698000 |
| Sunday, January 1, 2017 | 591033000 | 375907000 |
| Monday, January 1, 2018 | 657092000 | 394177000 |
| Tuesday, January 1, 2019 | 647793000 | 391396000 |
| Wednesday, January 1, 2020 | 604602000 | 426942000 |
| Friday, January 1, 2021 | 720500000 | 656655000 |
| Saturday, January 1, 2022 | 909800000 | 863261000 |
| Sunday, January 1, 2023 | 964100000 | 829900000 |
| Monday, January 1, 2024 | 677200000 | 781775000 |
In pursuit of knowledge
In the competitive landscape of industrial and HVAC sectors, Watsco, Inc. and IDEX Corporation have demonstrated remarkable EBITDA growth over the past decade. From 2014 to 2023, IDEX Corporation's EBITDA surged by approximately 91%, reflecting its robust operational efficiency and strategic market positioning. Meanwhile, Watsco, Inc. showcased an impressive 156% increase, underscoring its resilience and adaptability in the HVAC industry.
This analysis highlights the dynamic shifts in market leadership and the strategic maneuvers that have defined these industry giants.
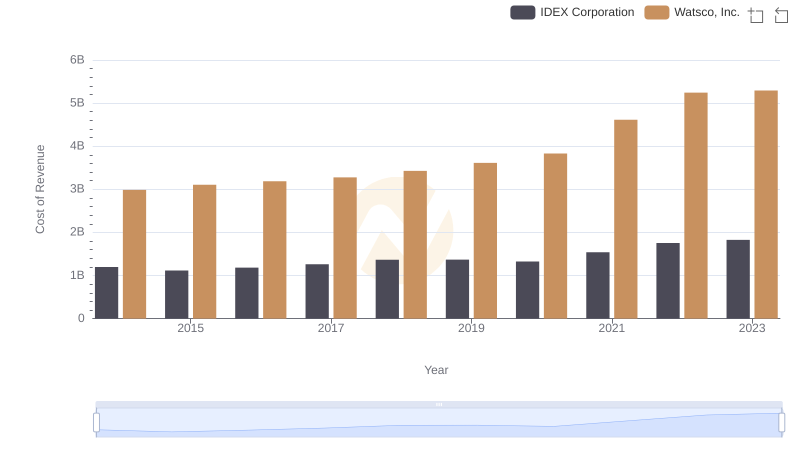
Cost Insights: Breaking Down Watsco, Inc. and IDEX Corporation's Expenses
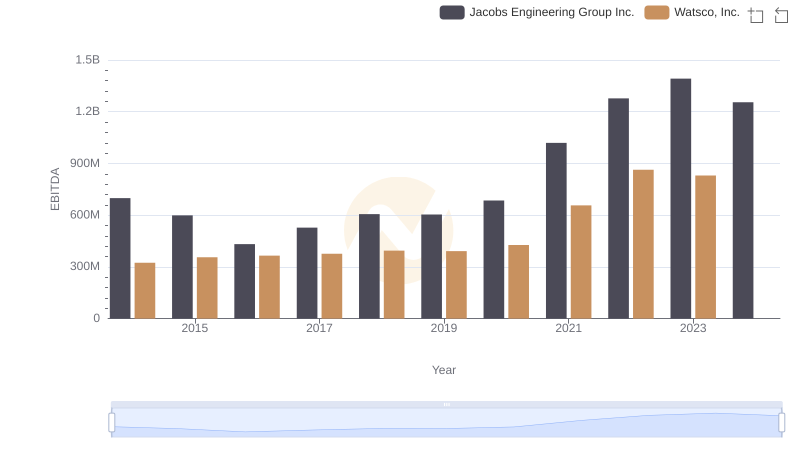
Professional EBITDA Benchmarking: Watsco, Inc. vs Jacobs Engineering Group Inc.
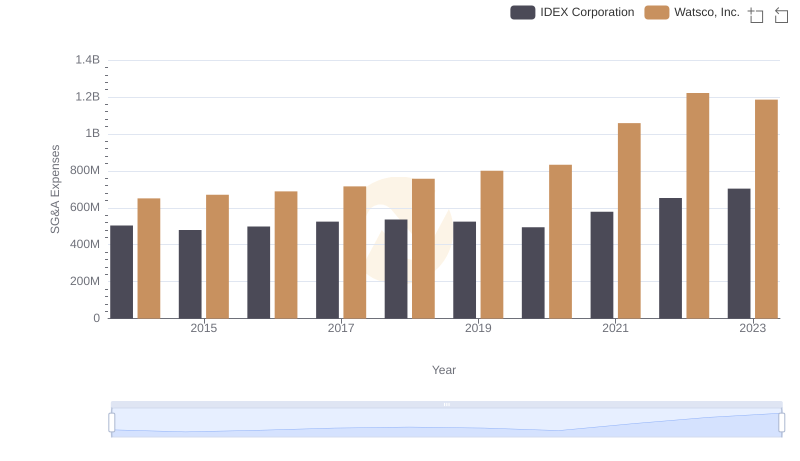
Comparing SG&A Expenses: Watsco, Inc. vs IDEX Corporation Trends and Insights
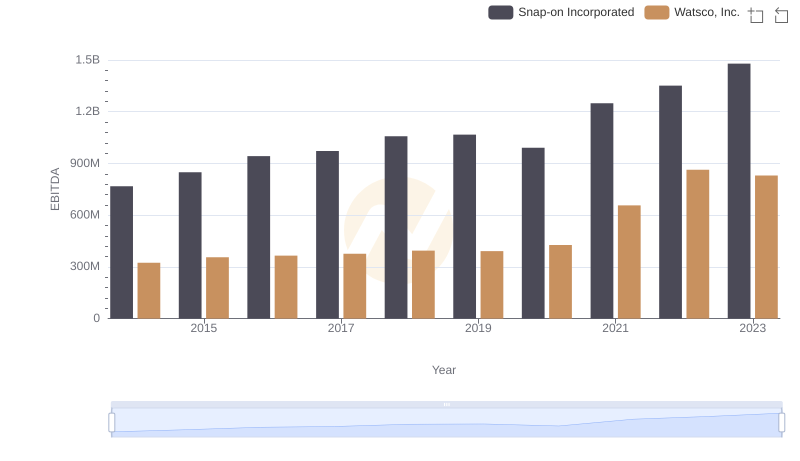
Comparative EBITDA Analysis: Watsco, Inc. vs Snap-on Incorporated
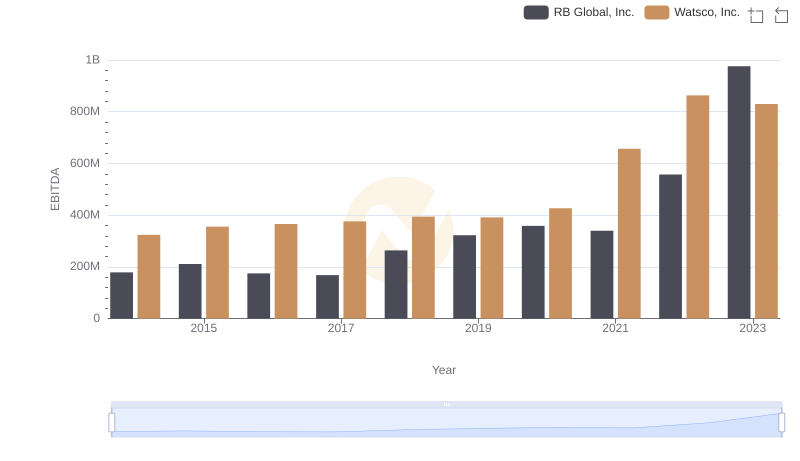
Comprehensive EBITDA Comparison: Watsco, Inc. vs RB Global, Inc.
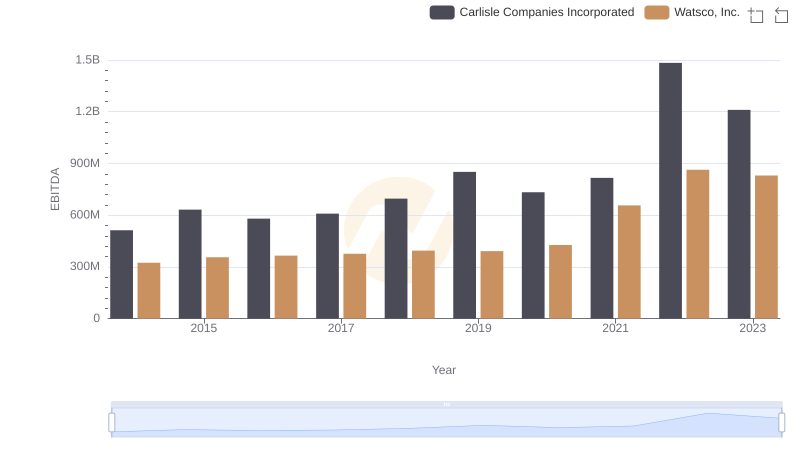
Watsco, Inc. and Carlisle Companies Incorporated: A Detailed Examination of EBITDA Performance
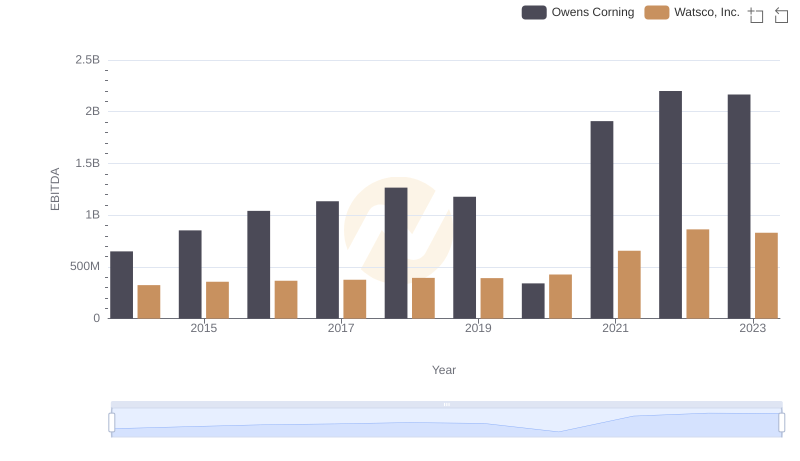
EBITDA Analysis: Evaluating Watsco, Inc. Against Owens Corning
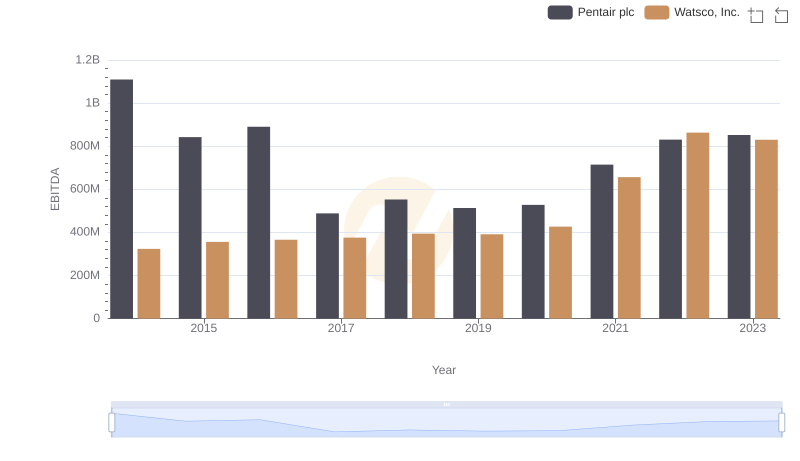
EBITDA Performance Review: Watsco, Inc. vs Pentair plc
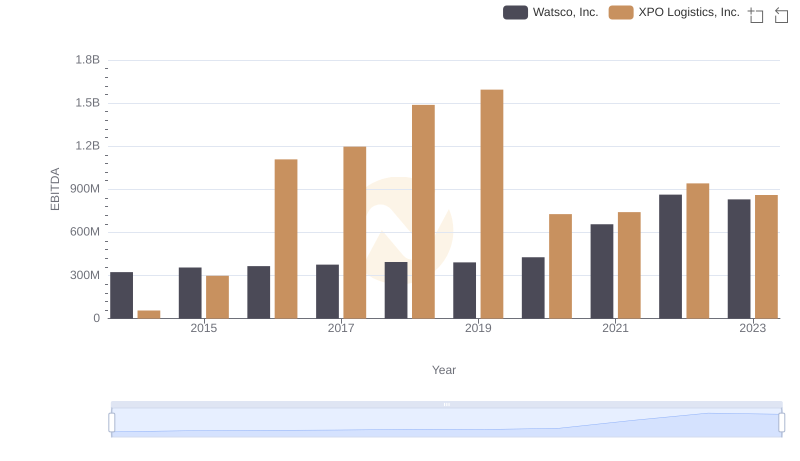
Comparative EBITDA Analysis: Watsco, Inc. vs XPO Logistics, Inc.