| __timestamp | Snap-on Incorporated | Watsco, Inc. |
|---|---|---|
| Wednesday, January 1, 2014 | 767600000 | 323674000 |
| Thursday, January 1, 2015 | 848900000 | 355865000 |
| Friday, January 1, 2016 | 942400000 | 365698000 |
| Sunday, January 1, 2017 | 971900000 | 375907000 |
| Monday, January 1, 2018 | 1057400000 | 394177000 |
| Tuesday, January 1, 2019 | 1067000000 | 391396000 |
| Wednesday, January 1, 2020 | 991400000 | 426942000 |
| Friday, January 1, 2021 | 1249100000 | 656655000 |
| Saturday, January 1, 2022 | 1351500000 | 863261000 |
| Sunday, January 1, 2023 | 1478800000 | 829900000 |
| Monday, January 1, 2024 | 1520700000 | 781775000 |
Unleashing the power of data
In the ever-evolving landscape of industrial and consumer goods, Watsco, Inc. and Snap-on Incorporated have emerged as formidable players. Over the past decade, from 2014 to 2023, these companies have demonstrated remarkable EBITDA growth, a key indicator of financial health and operational efficiency.
Snap-on Incorporated, a leader in tools and equipment, has seen its EBITDA soar by approximately 93%, from $768 million in 2014 to nearly $1.48 billion in 2023. This growth underscores Snap-on's strategic market positioning and robust demand for its products.
Meanwhile, Watsco, Inc., a major distributor of HVAC/R products, has experienced a significant 156% increase in EBITDA, rising from $324 million to $832 million over the same period. This impressive growth reflects Watsco's successful expansion and adaptation to market needs.
As these companies continue to innovate and expand, their financial trajectories offer valuable insights into the broader industrial sector's dynamics.
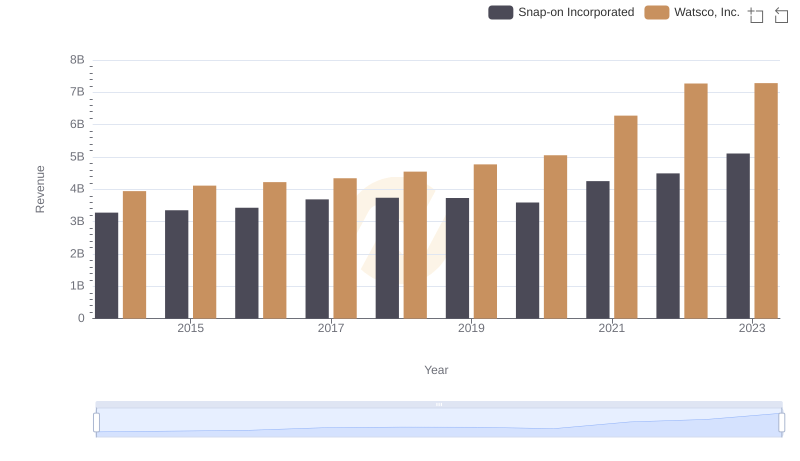
Watsco, Inc. and Snap-on Incorporated: A Comprehensive Revenue Analysis
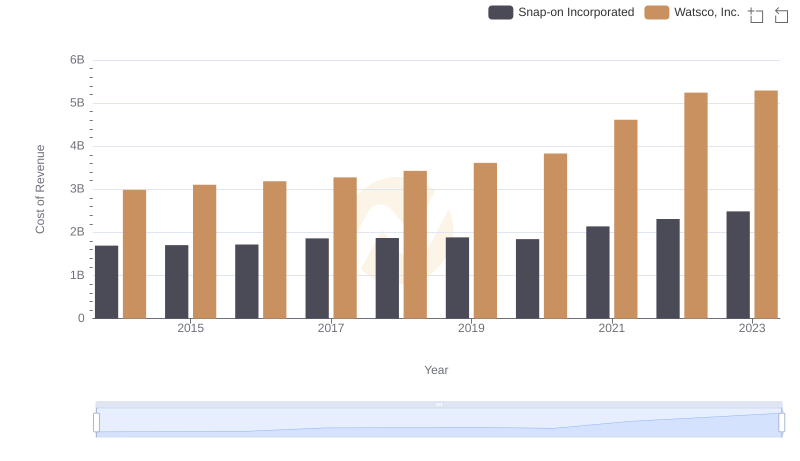
Cost Insights: Breaking Down Watsco, Inc. and Snap-on Incorporated's Expenses
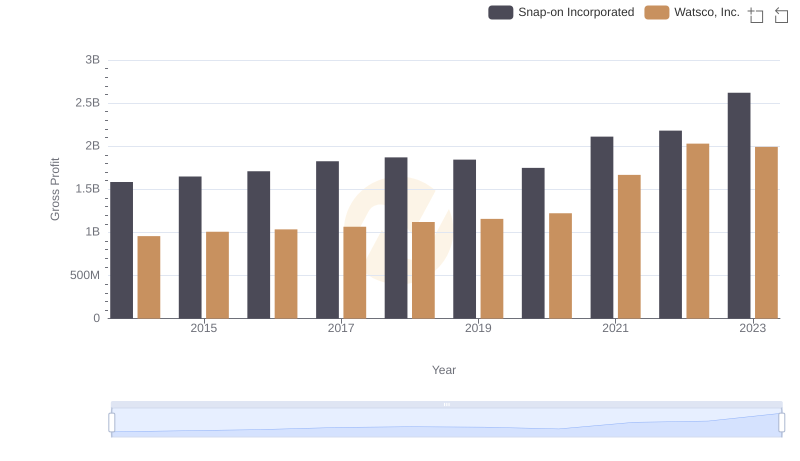
Gross Profit Comparison: Watsco, Inc. and Snap-on Incorporated Trends
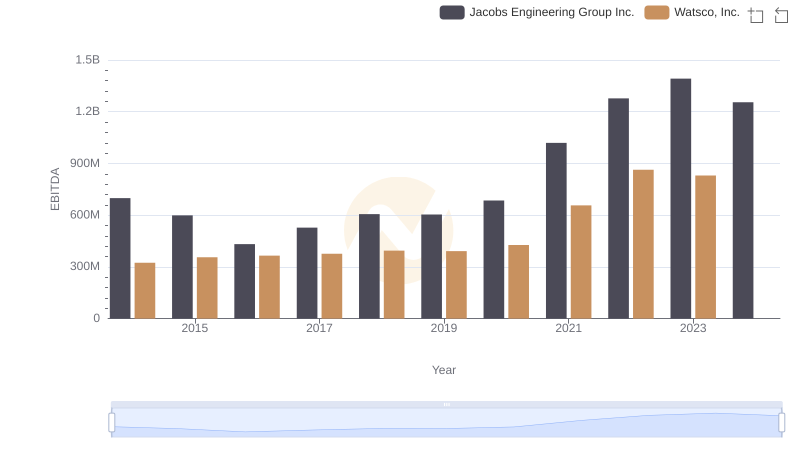
Professional EBITDA Benchmarking: Watsco, Inc. vs Jacobs Engineering Group Inc.
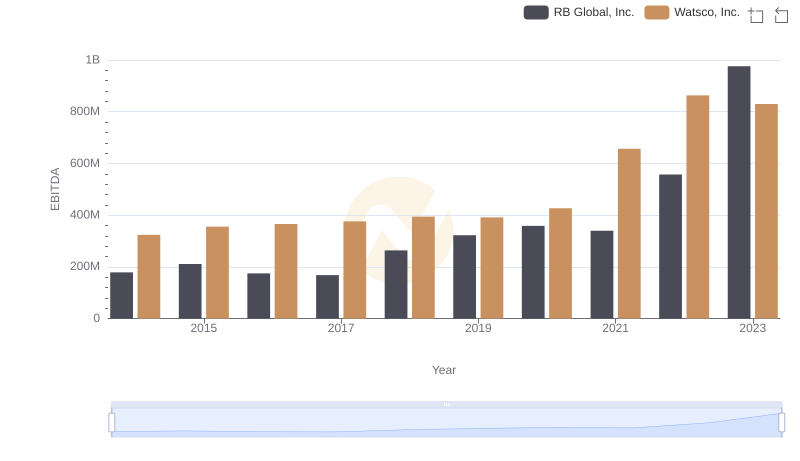
Comprehensive EBITDA Comparison: Watsco, Inc. vs RB Global, Inc.

Watsco, Inc. vs IDEX Corporation: In-Depth EBITDA Performance Comparison
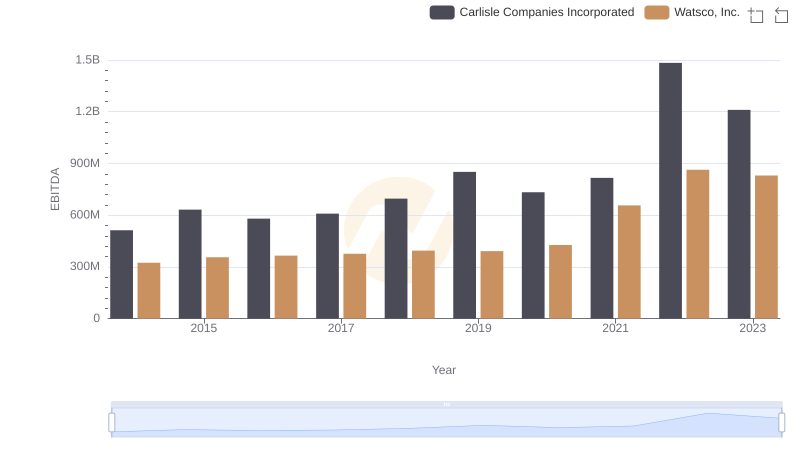
Watsco, Inc. and Carlisle Companies Incorporated: A Detailed Examination of EBITDA Performance
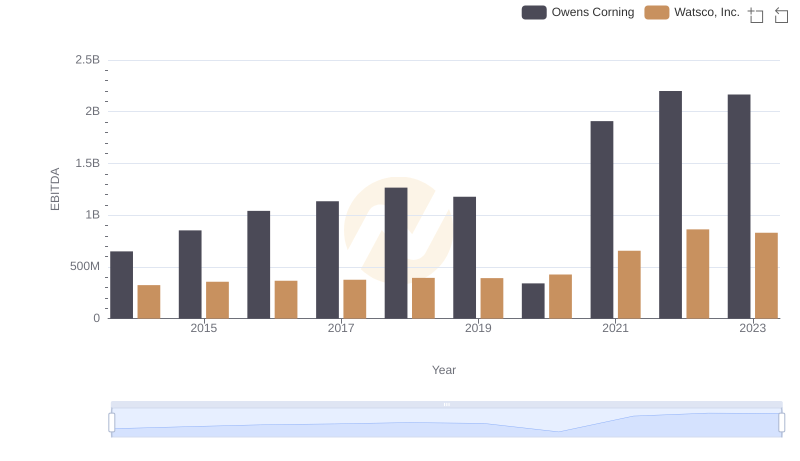
EBITDA Analysis: Evaluating Watsco, Inc. Against Owens Corning
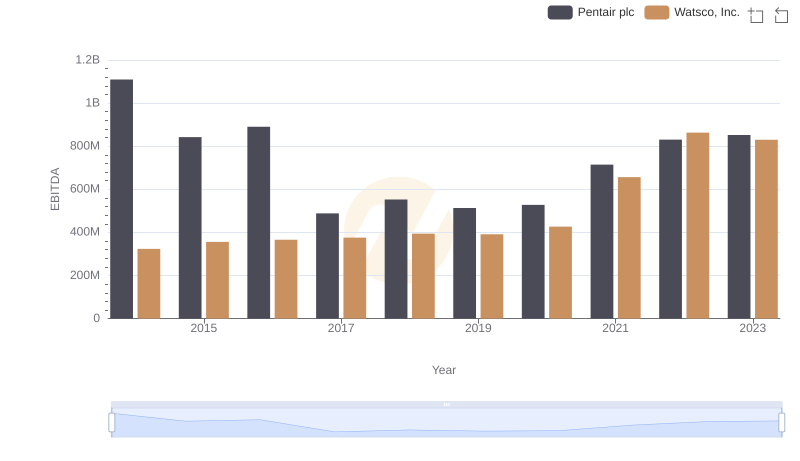
EBITDA Performance Review: Watsco, Inc. vs Pentair plc