| __timestamp | Expeditors International of Washington, Inc. | Watsco, Inc. |
|---|---|---|
| Wednesday, January 1, 2014 | 643940000 | 323674000 |
| Thursday, January 1, 2015 | 767496000 | 355865000 |
| Friday, January 1, 2016 | 716959000 | 365698000 |
| Sunday, January 1, 2017 | 749570000 | 375907000 |
| Monday, January 1, 2018 | 850582000 | 394177000 |
| Tuesday, January 1, 2019 | 817642000 | 391396000 |
| Wednesday, January 1, 2020 | 1013523000 | 426942000 |
| Friday, January 1, 2021 | 1975928000 | 656655000 |
| Saturday, January 1, 2022 | 1916506000 | 863261000 |
| Sunday, January 1, 2023 | 1087588000 | 829900000 |
| Monday, January 1, 2024 | 1154330000 | 781775000 |
Unleashing insights
In the ever-evolving landscape of American business, the financial performance of industry giants like Watsco, Inc. and Expeditors International of Washington, Inc. offers a fascinating glimpse into market dynamics. Over the past decade, from 2014 to 2023, these two companies have showcased distinct trajectories in their EBITDA growth.
Expeditors International, a leader in logistics, demonstrated a robust growth pattern, with EBITDA peaking in 2021 at nearly 200% of its 2014 value. This surge underscores the company's strategic adaptability in a rapidly changing global supply chain environment. Meanwhile, Watsco, a major player in HVAC distribution, exhibited a steady climb, achieving a remarkable 167% increase in EBITDA by 2022 compared to 2014.
These trends highlight the resilience and strategic foresight of both companies, offering valuable insights for investors and industry analysts alike.
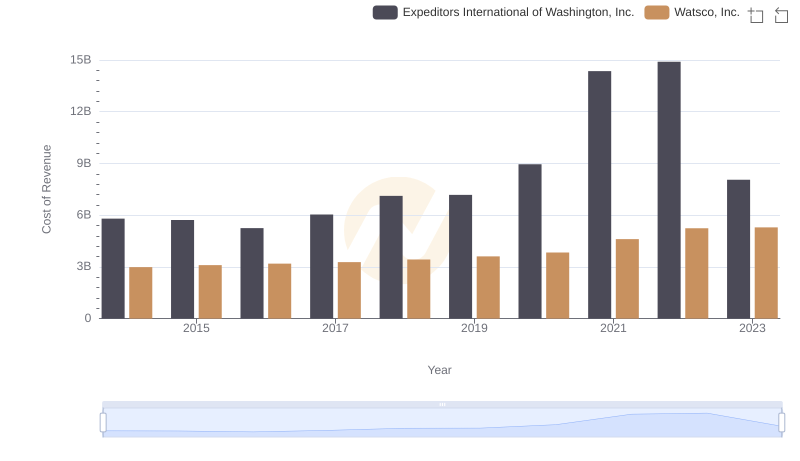
Cost of Revenue: Key Insights for Watsco, Inc. and Expeditors International of Washington, Inc.
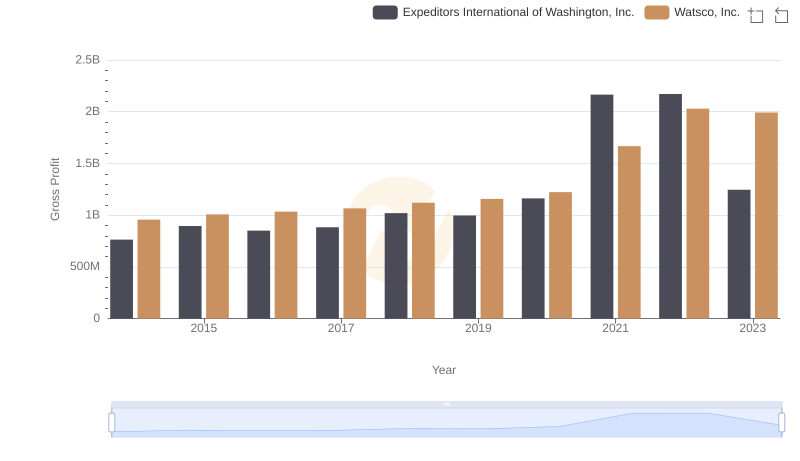
Gross Profit Trends Compared: Watsco, Inc. vs Expeditors International of Washington, Inc.
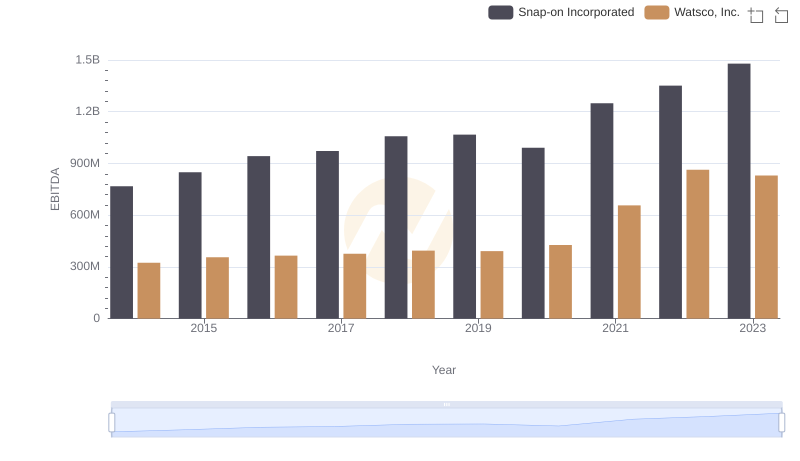
Comparative EBITDA Analysis: Watsco, Inc. vs Snap-on Incorporated
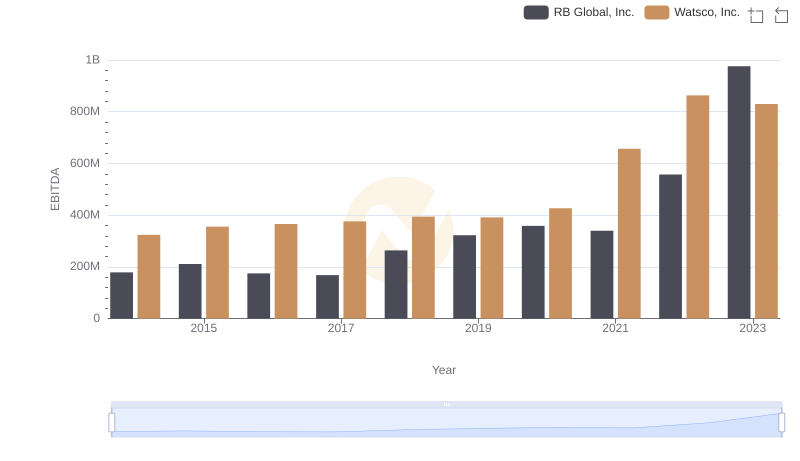
Comprehensive EBITDA Comparison: Watsco, Inc. vs RB Global, Inc.

Watsco, Inc. vs IDEX Corporation: In-Depth EBITDA Performance Comparison
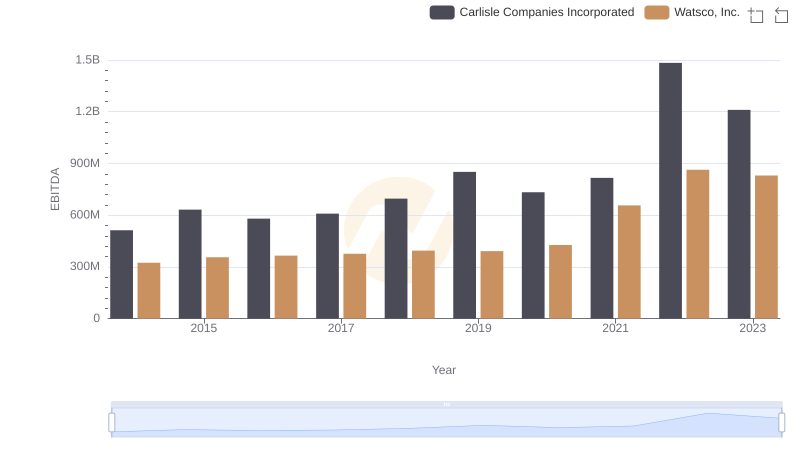
Watsco, Inc. and Carlisle Companies Incorporated: A Detailed Examination of EBITDA Performance
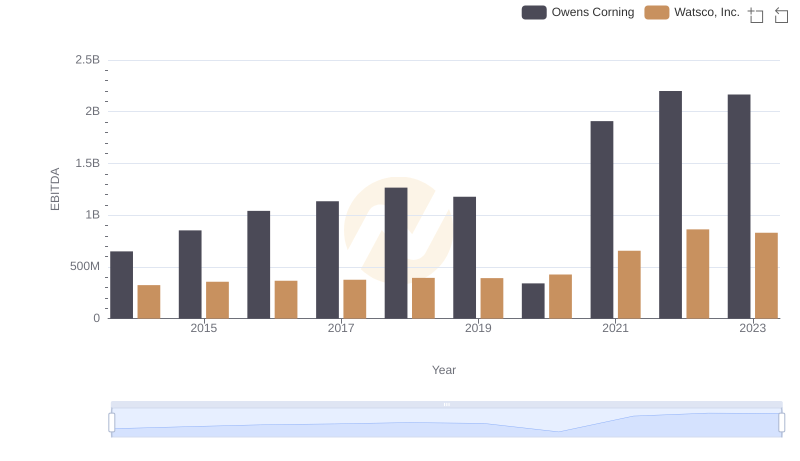
EBITDA Analysis: Evaluating Watsco, Inc. Against Owens Corning
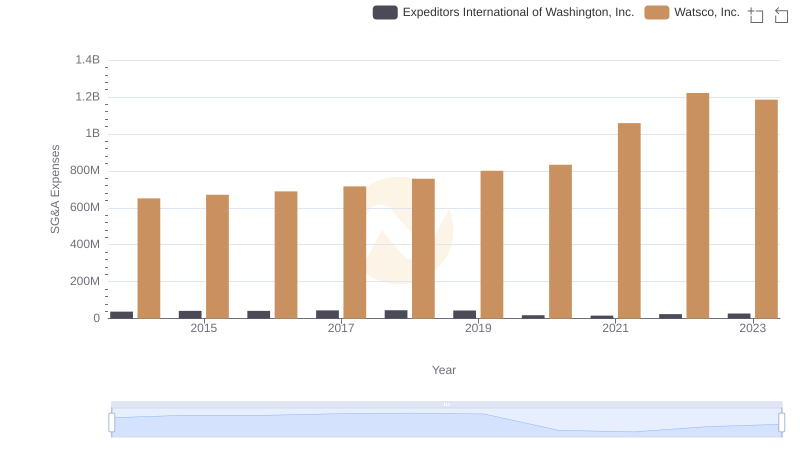
SG&A Efficiency Analysis: Comparing Watsco, Inc. and Expeditors International of Washington, Inc.
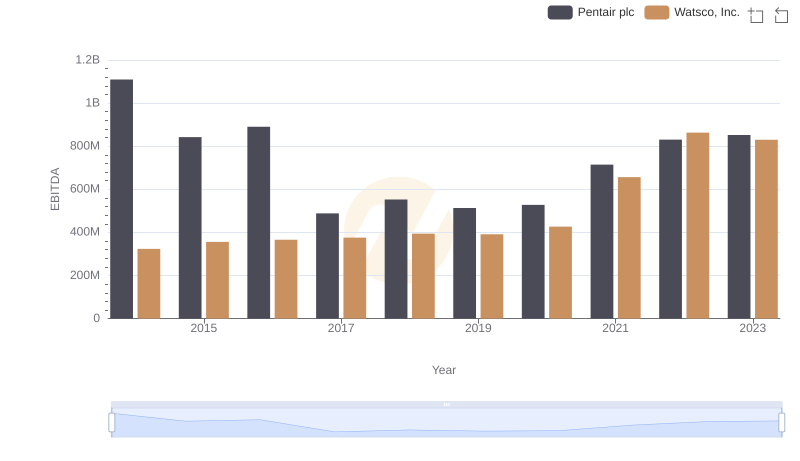
EBITDA Performance Review: Watsco, Inc. vs Pentair plc
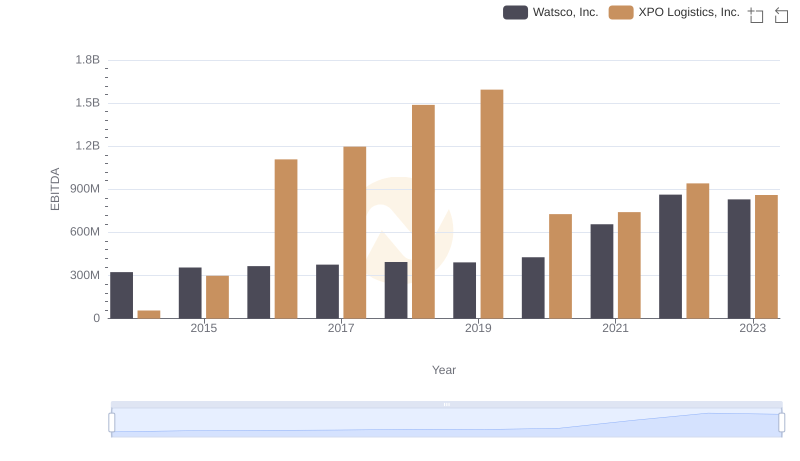
Comparative EBITDA Analysis: Watsco, Inc. vs XPO Logistics, Inc.
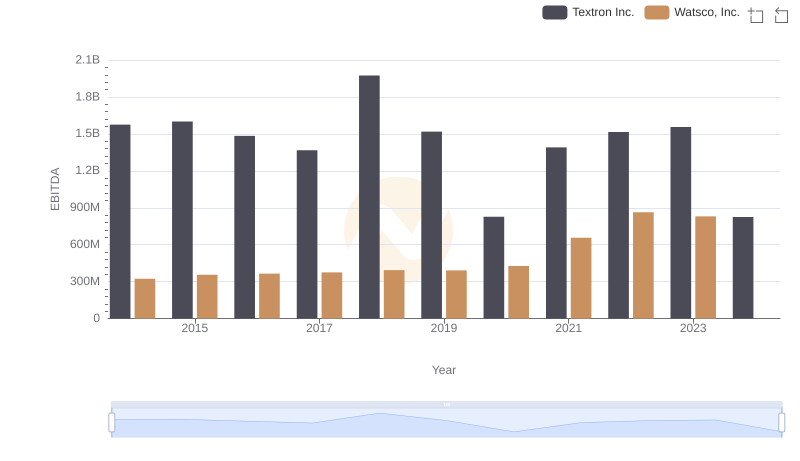
A Side-by-Side Analysis of EBITDA: Watsco, Inc. and Textron Inc.