| __timestamp | Owens Corning | Watsco, Inc. |
|---|---|---|
| Wednesday, January 1, 2014 | 650000000 | 323674000 |
| Thursday, January 1, 2015 | 853000000 | 355865000 |
| Friday, January 1, 2016 | 1041000000 | 365698000 |
| Sunday, January 1, 2017 | 1134000000 | 375907000 |
| Monday, January 1, 2018 | 1266000000 | 394177000 |
| Tuesday, January 1, 2019 | 1178000000 | 391396000 |
| Wednesday, January 1, 2020 | 341000000 | 426942000 |
| Friday, January 1, 2021 | 1909000000 | 656655000 |
| Saturday, January 1, 2022 | 2200000000 | 863261000 |
| Sunday, January 1, 2023 | 2166000000 | 829900000 |
| Monday, January 1, 2024 | 781775000 |
Unlocking the unknown
In the ever-evolving landscape of industrial giants, understanding financial health is crucial. This analysis delves into the EBITDA performance of Watsco, Inc. and Owens Corning from 2014 to 2023. Over this period, Owens Corning consistently outperformed Watsco, Inc., with an average EBITDA nearly 2.5 times higher. Notably, Owens Corning's EBITDA surged by approximately 235% from 2014 to 2023, peaking in 2022. In contrast, Watsco, Inc. demonstrated a steady growth trajectory, with a 157% increase over the same period, reaching its zenith in 2022. The year 2020 marked a downturn for Owens Corning, with a significant dip, while Watsco, Inc. showed resilience with a 9% increase. This comparative analysis highlights the dynamic nature of these companies' financial strategies and market adaptability, offering valuable insights for investors and industry analysts alike.
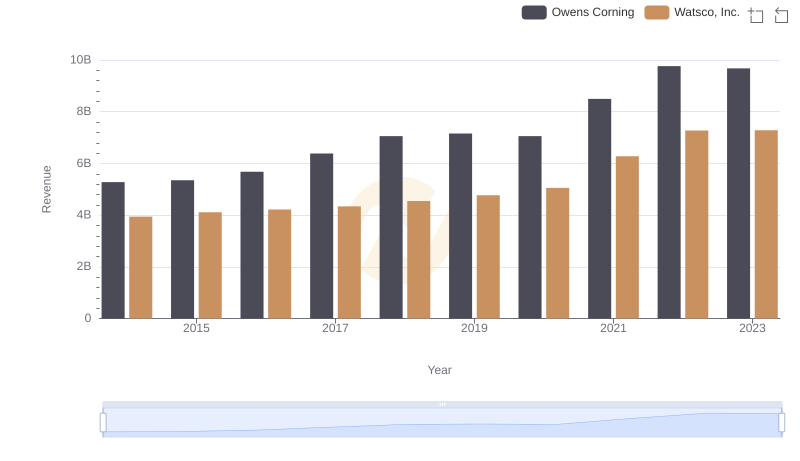
Watsco, Inc. vs Owens Corning: Annual Revenue Growth Compared
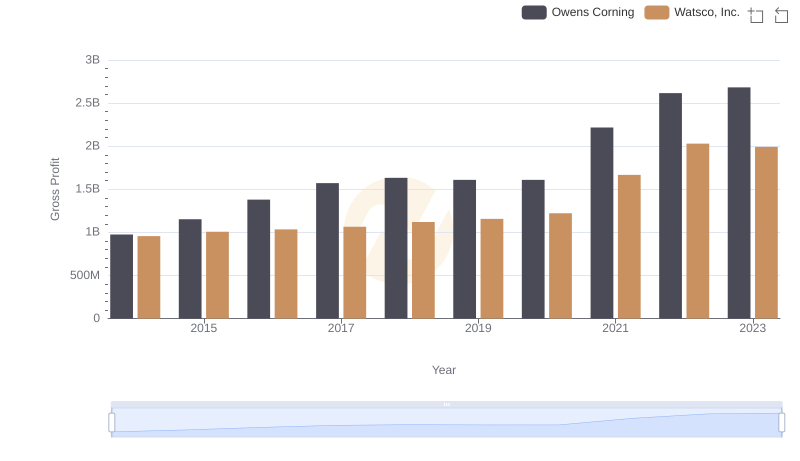
Gross Profit Trends Compared: Watsco, Inc. vs Owens Corning
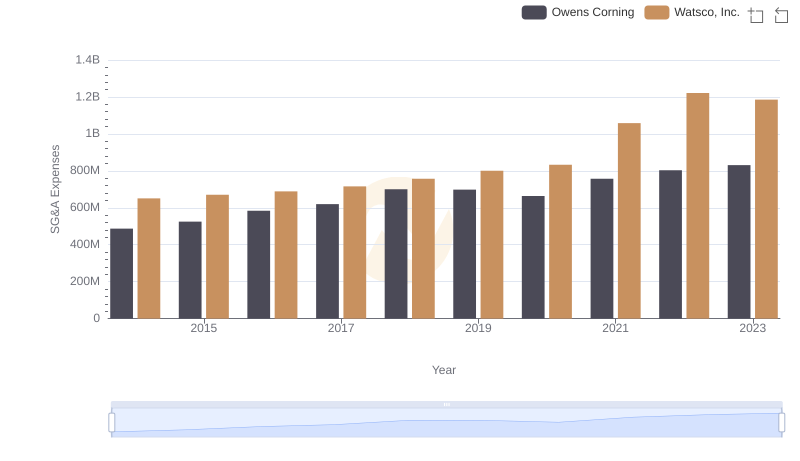
Selling, General, and Administrative Costs: Watsco, Inc. vs Owens Corning
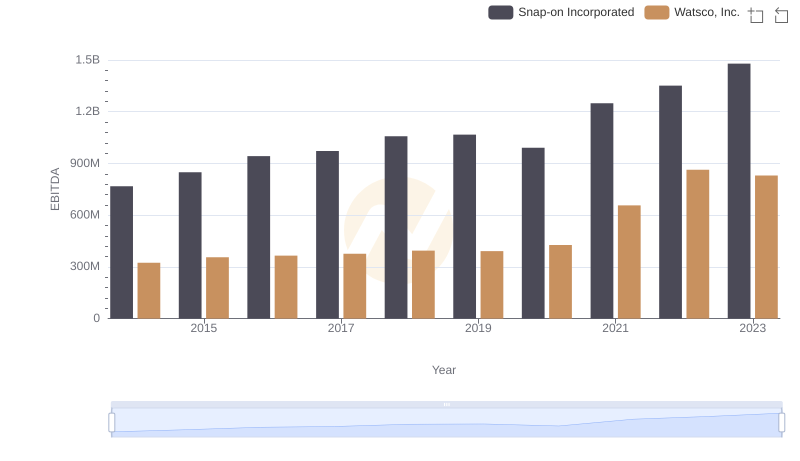
Comparative EBITDA Analysis: Watsco, Inc. vs Snap-on Incorporated
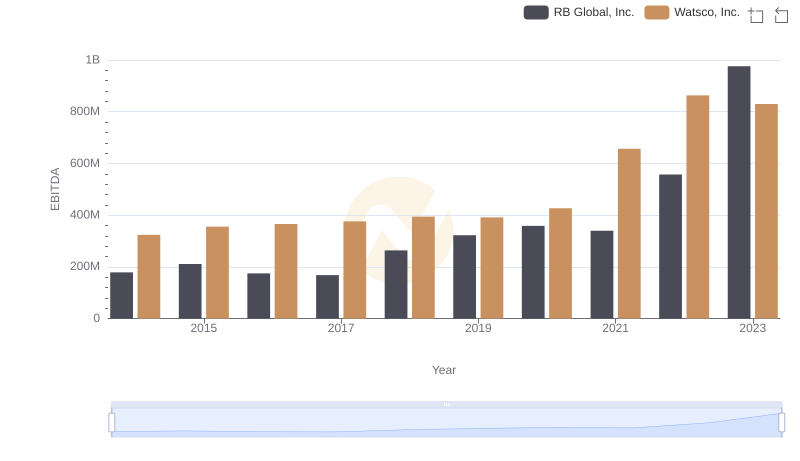
Comprehensive EBITDA Comparison: Watsco, Inc. vs RB Global, Inc.

Watsco, Inc. vs IDEX Corporation: In-Depth EBITDA Performance Comparison
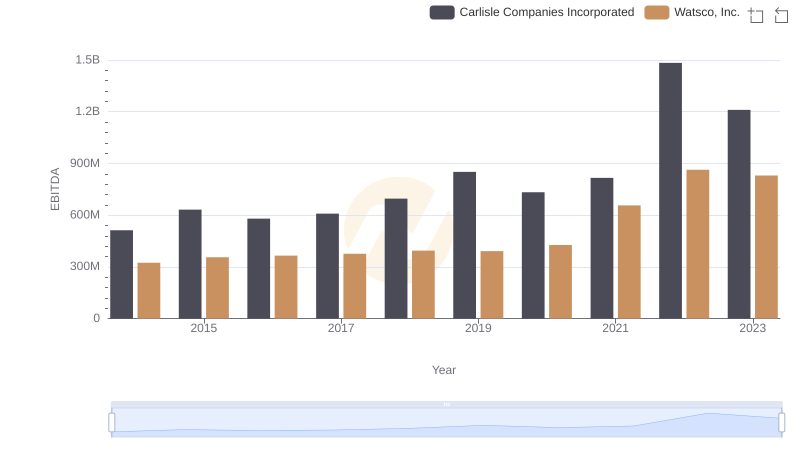
Watsco, Inc. and Carlisle Companies Incorporated: A Detailed Examination of EBITDA Performance
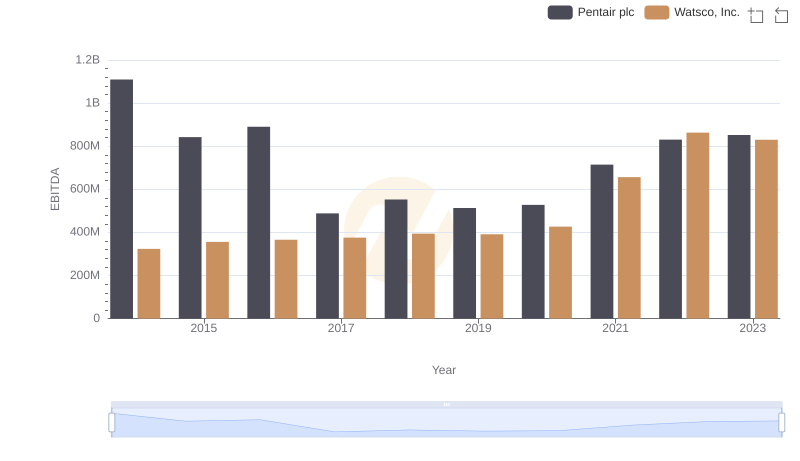
EBITDA Performance Review: Watsco, Inc. vs Pentair plc
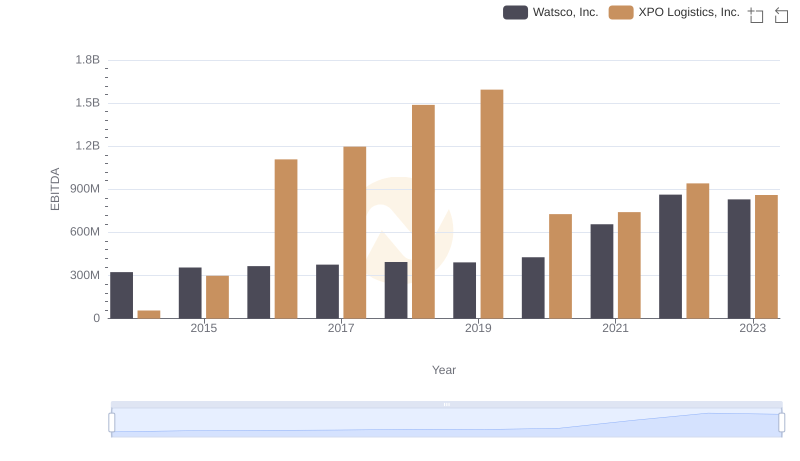
Comparative EBITDA Analysis: Watsco, Inc. vs XPO Logistics, Inc.
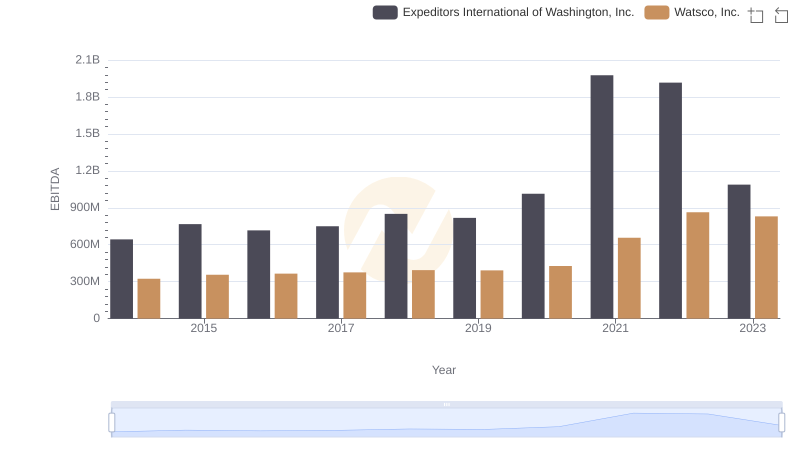
Comprehensive EBITDA Comparison: Watsco, Inc. vs Expeditors International of Washington, Inc.