| __timestamp | Pentair plc | Watsco, Inc. |
|---|---|---|
| Wednesday, January 1, 2014 | 1109300000 | 323674000 |
| Thursday, January 1, 2015 | 842400000 | 355865000 |
| Friday, January 1, 2016 | 890400000 | 365698000 |
| Sunday, January 1, 2017 | 488600000 | 375907000 |
| Monday, January 1, 2018 | 552800000 | 394177000 |
| Tuesday, January 1, 2019 | 513200000 | 391396000 |
| Wednesday, January 1, 2020 | 527600000 | 426942000 |
| Friday, January 1, 2021 | 714400000 | 656655000 |
| Saturday, January 1, 2022 | 830400000 | 863261000 |
| Sunday, January 1, 2023 | 852000000 | 829900000 |
| Monday, January 1, 2024 | 803800000 | 781775000 |
Unleashing insights
In the ever-evolving landscape of industrial giants, Watsco, Inc. and Pentair plc have showcased intriguing EBITDA trends over the past decade. From 2014 to 2023, Pentair plc's EBITDA peaked in 2014, with a notable 1.1 billion, before experiencing a 56% decline by 2017. However, a resilient recovery saw it climb back to 852 million by 2023. Meanwhile, Watsco, Inc. demonstrated a steady upward trajectory, with its EBITDA growing by 156% from 2014 to 2022, reaching a high of 863 million. This growth reflects Watsco's strategic adaptability and market resilience. The contrasting paths of these two companies highlight the diverse strategies and market conditions influencing their financial performance. As we delve into these figures, it becomes evident that while Pentair faced volatility, Watsco capitalized on consistent growth, offering valuable insights into their operational strategies and market positioning.
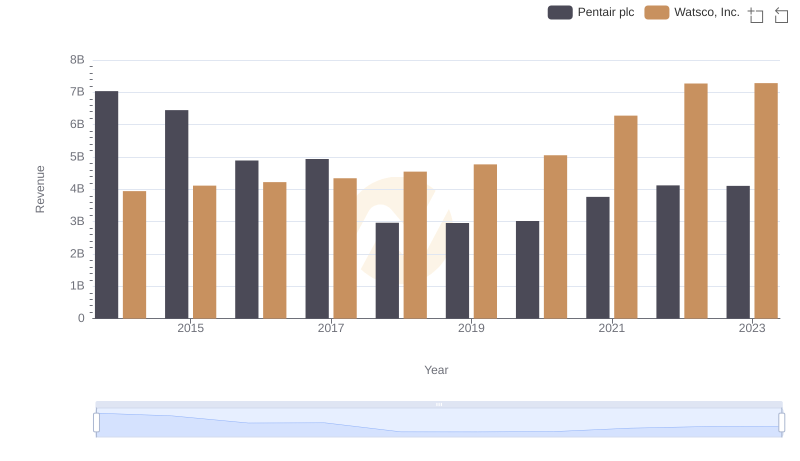
Revenue Insights: Watsco, Inc. and Pentair plc Performance Compared
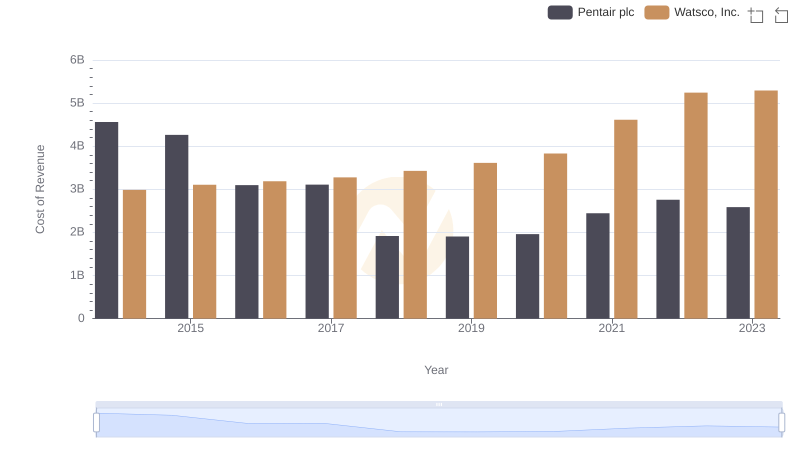
Cost of Revenue Trends: Watsco, Inc. vs Pentair plc
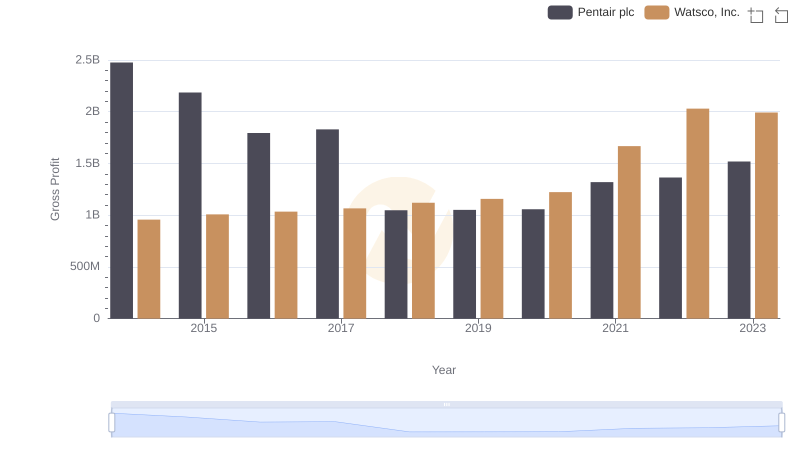
Gross Profit Comparison: Watsco, Inc. and Pentair plc Trends
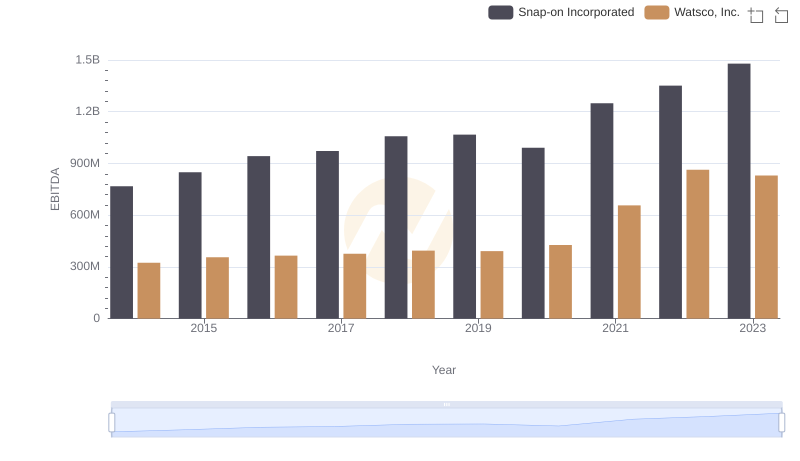
Comparative EBITDA Analysis: Watsco, Inc. vs Snap-on Incorporated
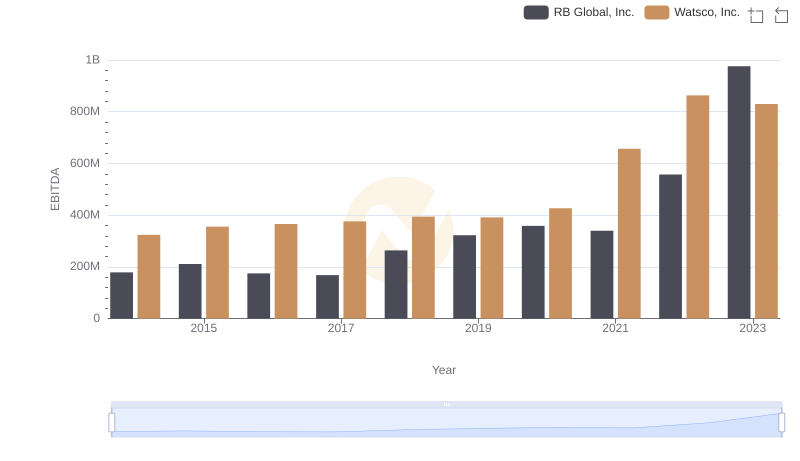
Comprehensive EBITDA Comparison: Watsco, Inc. vs RB Global, Inc.

Watsco, Inc. vs IDEX Corporation: In-Depth EBITDA Performance Comparison
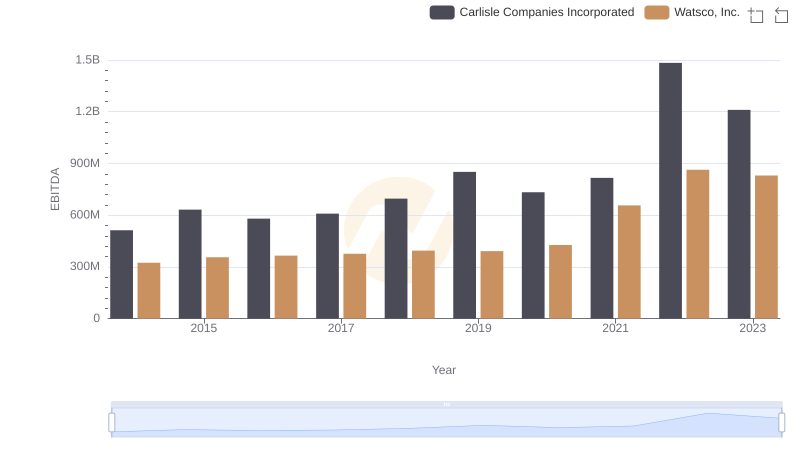
Watsco, Inc. and Carlisle Companies Incorporated: A Detailed Examination of EBITDA Performance
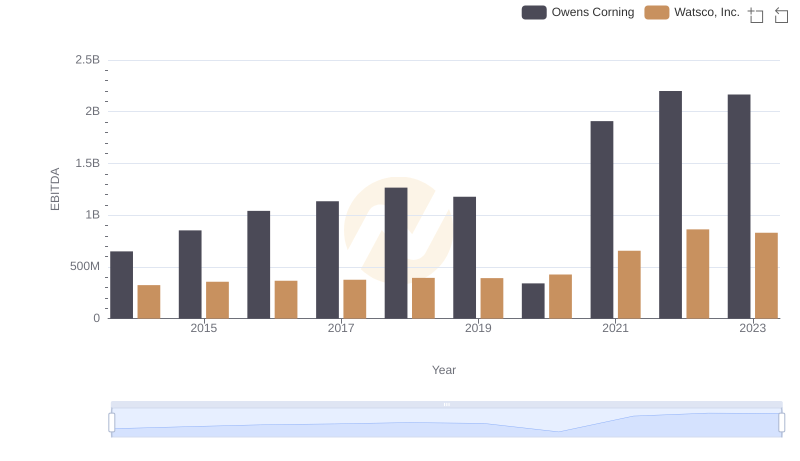
EBITDA Analysis: Evaluating Watsco, Inc. Against Owens Corning
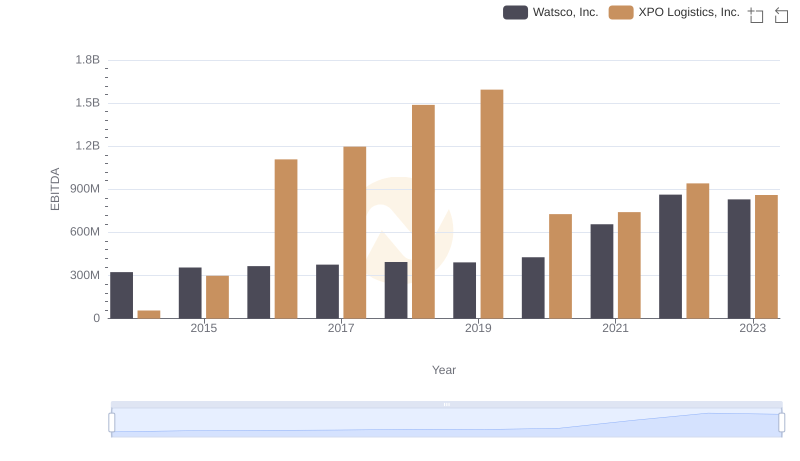
Comparative EBITDA Analysis: Watsco, Inc. vs XPO Logistics, Inc.
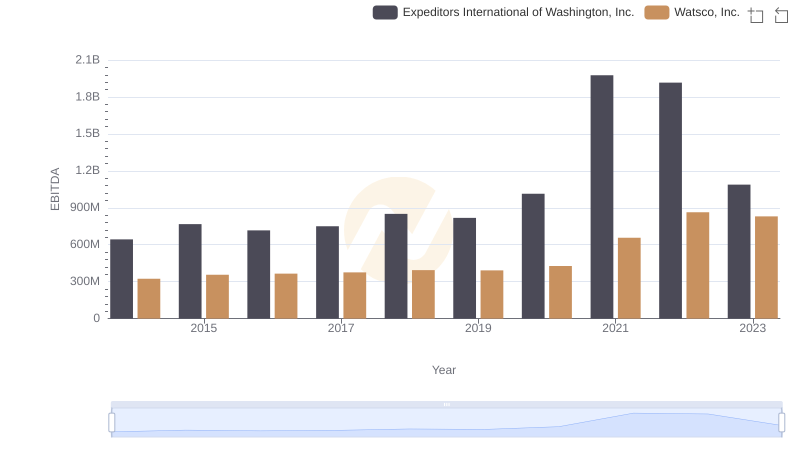
Comprehensive EBITDA Comparison: Watsco, Inc. vs Expeditors International of Washington, Inc.