| __timestamp | Northrop Grumman Corporation | Waste Management, Inc. |
|---|---|---|
| Wednesday, January 1, 2014 | 18378000000 | 9002000000 |
| Thursday, January 1, 2015 | 17884000000 | 8231000000 |
| Friday, January 1, 2016 | 18731000000 | 8486000000 |
| Sunday, January 1, 2017 | 19849000000 | 9021000000 |
| Monday, January 1, 2018 | 23304000000 | 9249000000 |
| Tuesday, January 1, 2019 | 26582000000 | 9496000000 |
| Wednesday, January 1, 2020 | 29321000000 | 9341000000 |
| Friday, January 1, 2021 | 28399000000 | 11111000000 |
| Saturday, January 1, 2022 | 29128000000 | 12294000000 |
| Sunday, January 1, 2023 | 32739000000 | 12606000000 |
| Monday, January 1, 2024 | 32671000000 | 13383000000 |
Unveiling the hidden dimensions of data
In the ever-evolving landscape of corporate expenses, understanding cost dynamics is crucial. Over the past decade, Northrop Grumman Corporation and Waste Management, Inc. have showcased distinct cost trajectories. Northrop Grumman's cost of revenue has surged by approximately 78% from 2014 to 2023, reflecting its expanding operations in the defense sector. In contrast, Waste Management, Inc. has seen a more modest increase of around 40% in the same period, highlighting its steady growth in the waste management industry.
These insights provide a window into the financial strategies of two industry giants, offering valuable lessons for businesses navigating similar sectors.
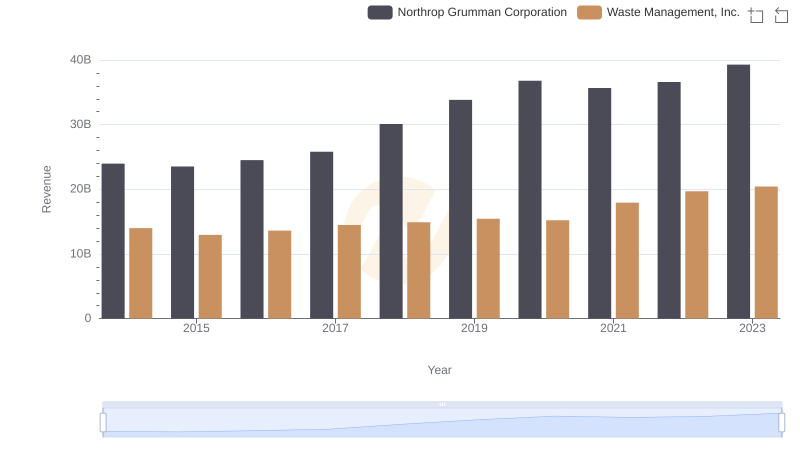
Waste Management, Inc. vs Northrop Grumman Corporation: Annual Revenue Growth Compared
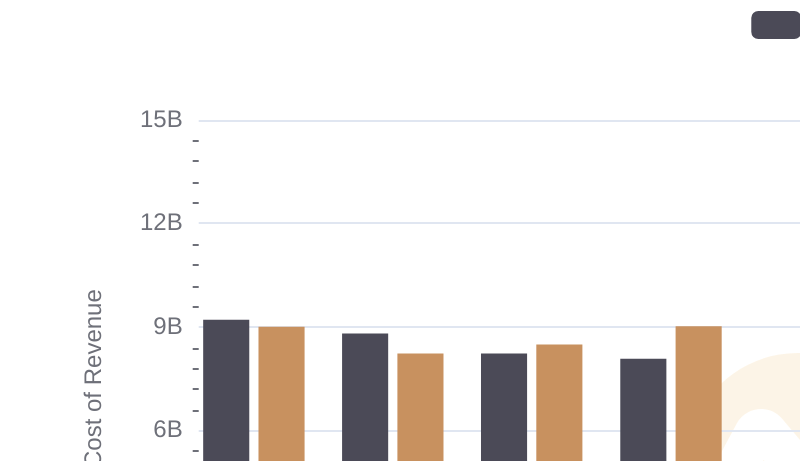
Comparing Cost of Revenue Efficiency: Waste Management, Inc. vs Thomson Reuters Corporation
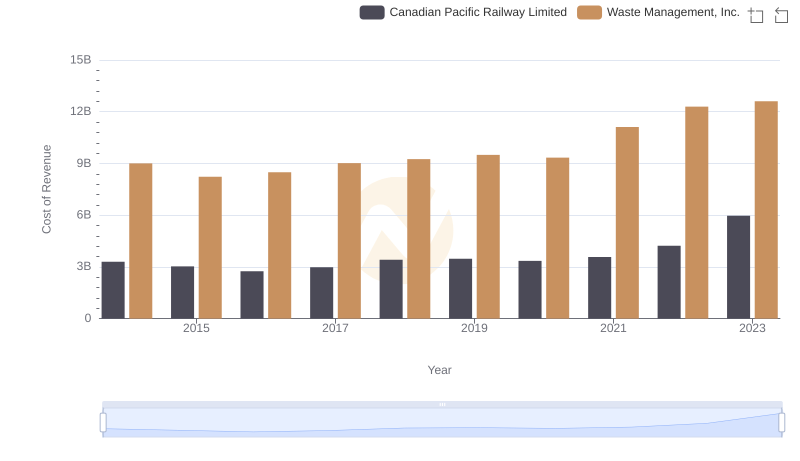
Comparing Cost of Revenue Efficiency: Waste Management, Inc. vs Canadian Pacific Railway Limited
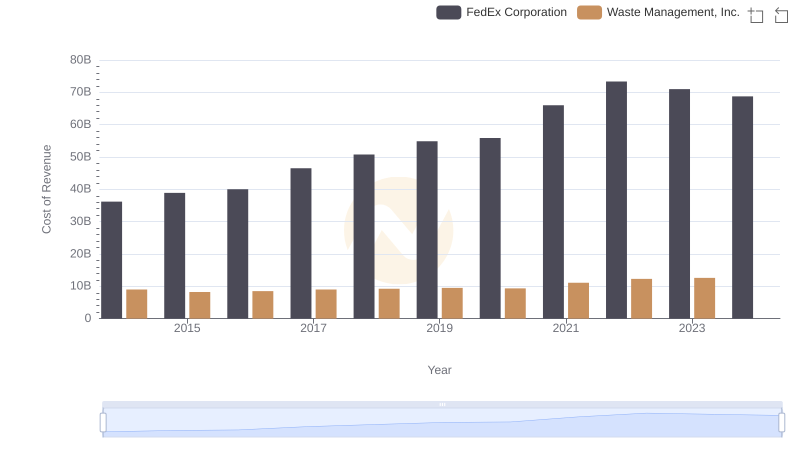
Comparing Cost of Revenue Efficiency: Waste Management, Inc. vs FedEx Corporation
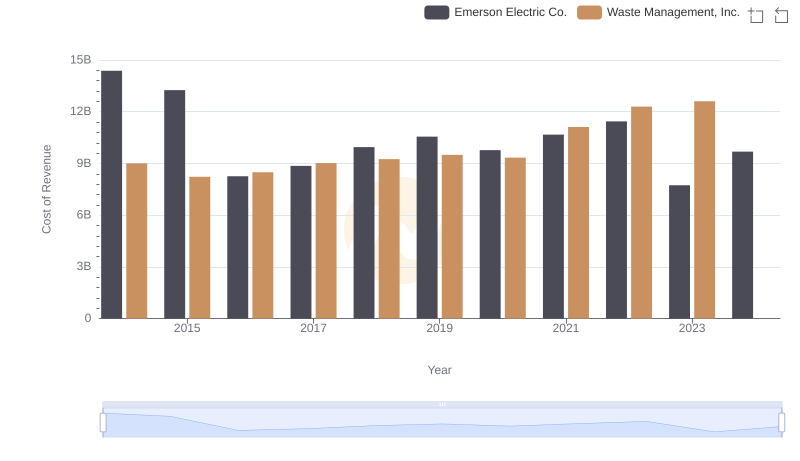
Cost of Revenue Trends: Waste Management, Inc. vs Emerson Electric Co.
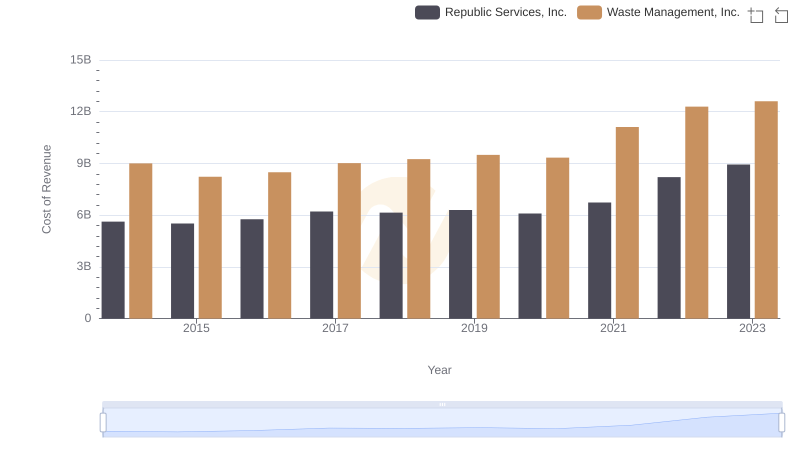
Analyzing Cost of Revenue: Waste Management, Inc. and Republic Services, Inc.
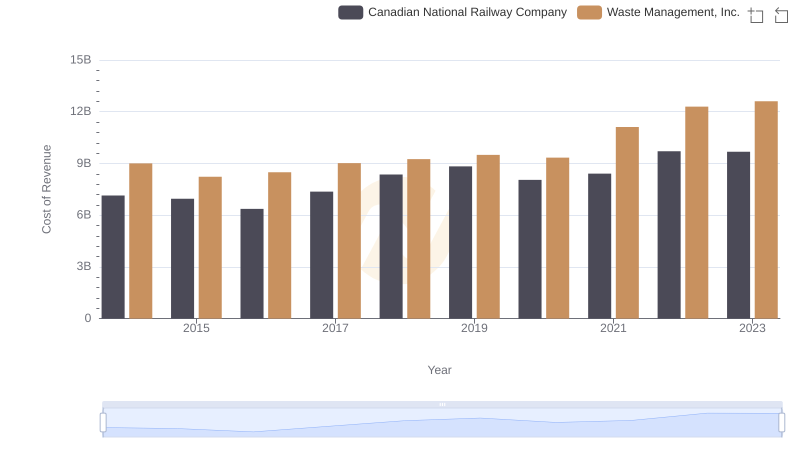
Waste Management, Inc. vs Canadian National Railway Company: Efficiency in Cost of Revenue Explored
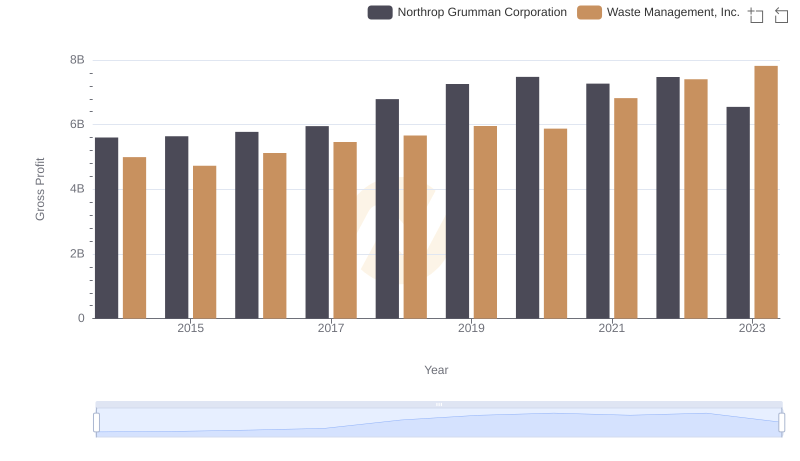
Gross Profit Analysis: Comparing Waste Management, Inc. and Northrop Grumman Corporation
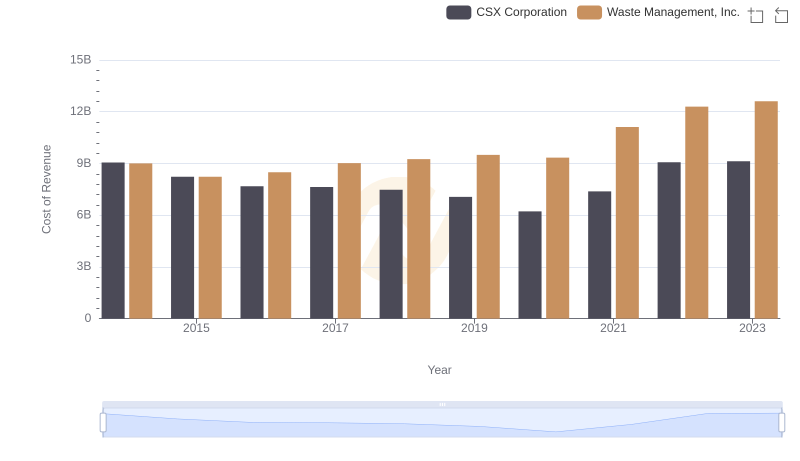
Cost of Revenue Comparison: Waste Management, Inc. vs CSX Corporation
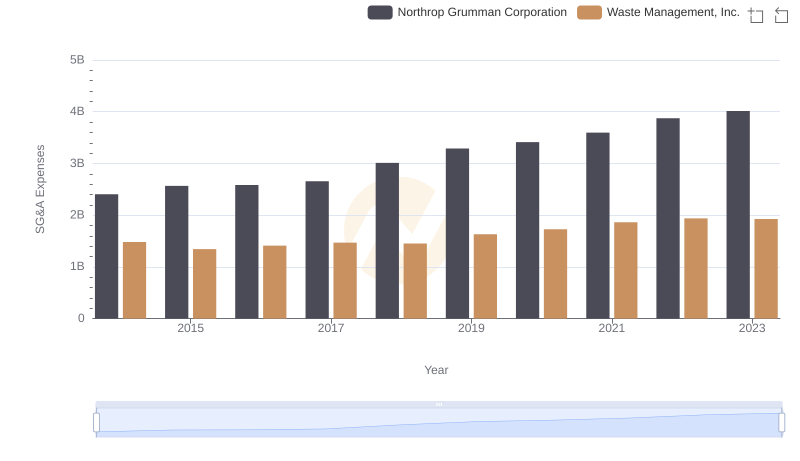
Waste Management, Inc. vs Northrop Grumman Corporation: SG&A Expense Trends
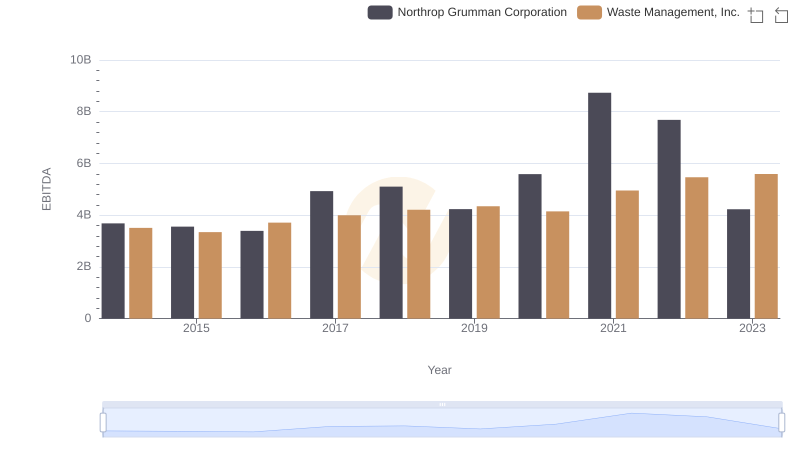
Waste Management, Inc. and Northrop Grumman Corporation: A Detailed Examination of EBITDA Performance