| __timestamp | Northrop Grumman Corporation | Waste Management, Inc. |
|---|---|---|
| Wednesday, January 1, 2014 | 5601000000 | 4994000000 |
| Thursday, January 1, 2015 | 5642000000 | 4730000000 |
| Friday, January 1, 2016 | 5777000000 | 5123000000 |
| Sunday, January 1, 2017 | 5954000000 | 5464000000 |
| Monday, January 1, 2018 | 6791000000 | 5665000000 |
| Tuesday, January 1, 2019 | 7259000000 | 5959000000 |
| Wednesday, January 1, 2020 | 7478000000 | 5877000000 |
| Friday, January 1, 2021 | 7268000000 | 6820000000 |
| Saturday, January 1, 2022 | 7474000000 | 7404000000 |
| Sunday, January 1, 2023 | 6551000000 | 7820000000 |
| Monday, January 1, 2024 | 8362000000 | 8680000000 |
Unleashing the power of data
In the ever-evolving landscape of American industry, Waste Management, Inc. and Northrop Grumman Corporation stand as titans in their respective fields. Over the past decade, from 2014 to 2023, these companies have showcased intriguing trends in gross profit. Northrop Grumman, a leader in aerospace and defense, saw its gross profit grow steadily, peaking in 2020 with a 33% increase from 2014. However, a slight dip in 2023 brought it down to 6.6 billion, a 12% decrease from its peak. Meanwhile, Waste Management, a giant in environmental services, experienced a robust growth trajectory, culminating in a 57% increase by 2023, reaching 7.8 billion. This growth reflects the rising importance of sustainable practices. As these industries evolve, the financial narratives of these companies offer a glimpse into broader economic and environmental trends.
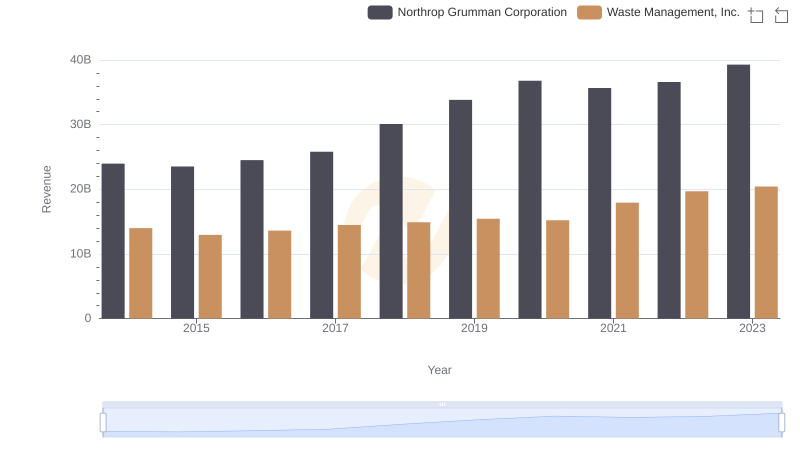
Waste Management, Inc. vs Northrop Grumman Corporation: Annual Revenue Growth Compared
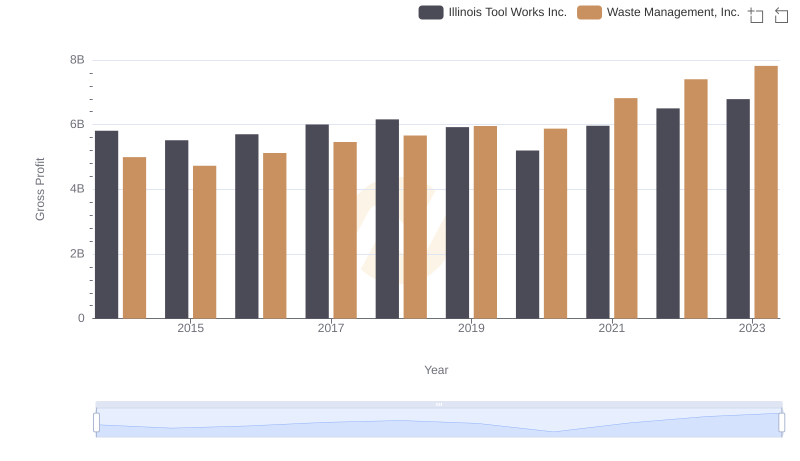
Who Generates Higher Gross Profit? Waste Management, Inc. or Illinois Tool Works Inc.
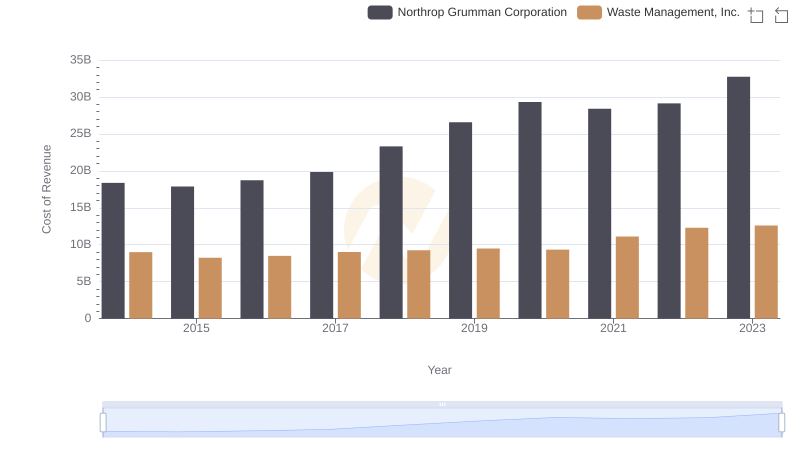
Cost Insights: Breaking Down Waste Management, Inc. and Northrop Grumman Corporation's Expenses
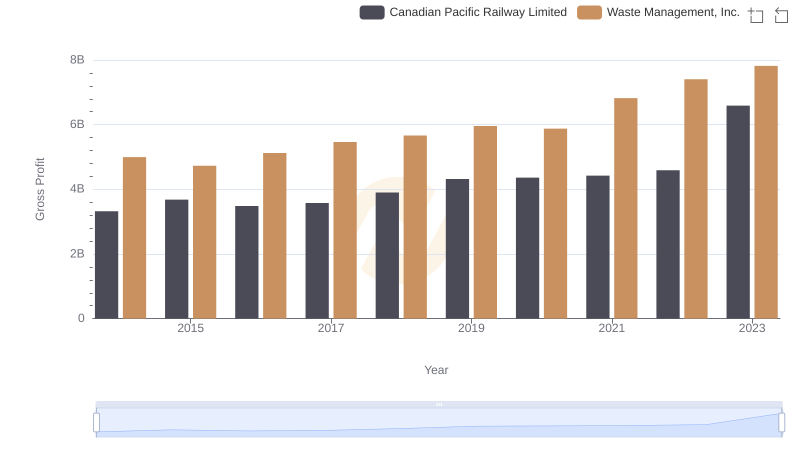
Gross Profit Comparison: Waste Management, Inc. and Canadian Pacific Railway Limited Trends
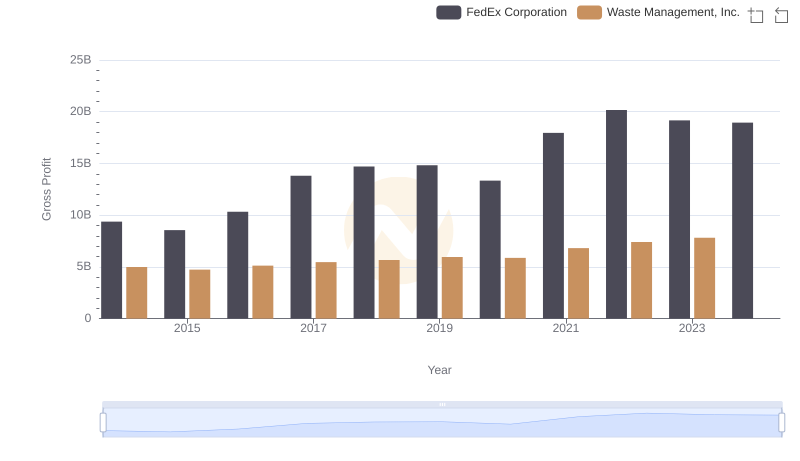
Gross Profit Analysis: Comparing Waste Management, Inc. and FedEx Corporation
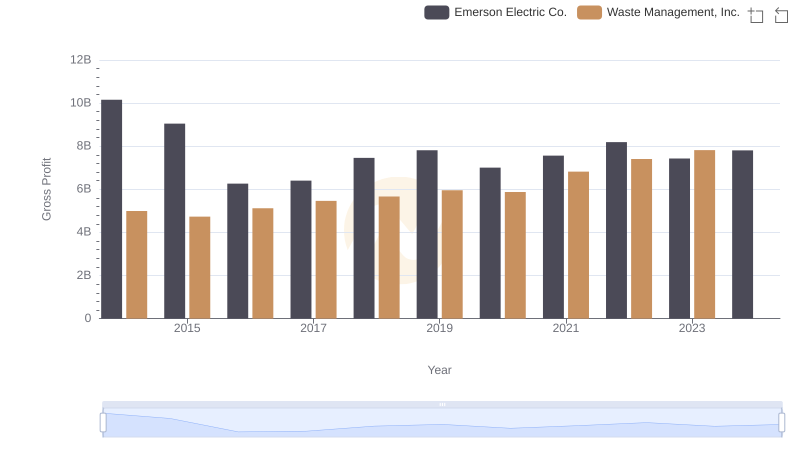
Who Generates Higher Gross Profit? Waste Management, Inc. or Emerson Electric Co.
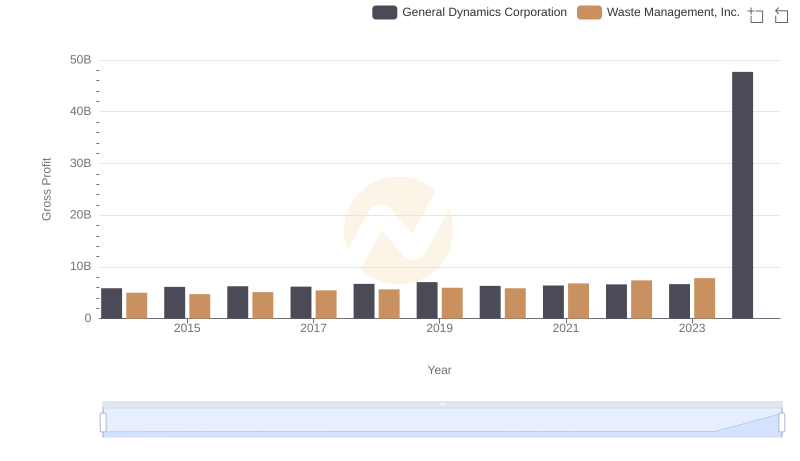
Gross Profit Trends Compared: Waste Management, Inc. vs General Dynamics Corporation
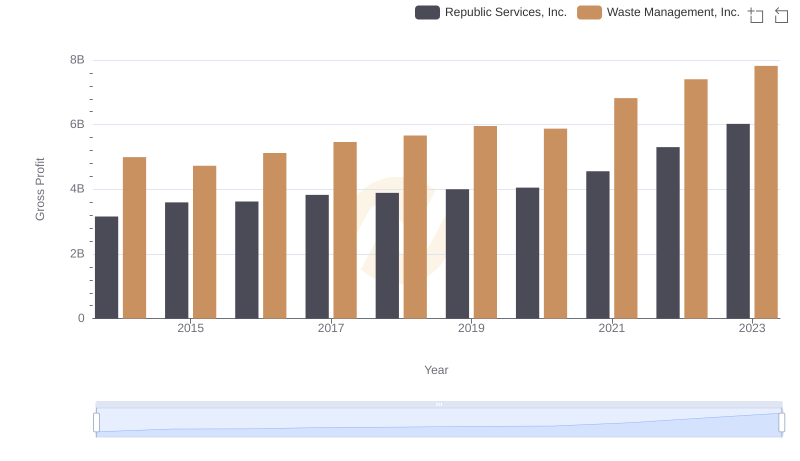
Waste Management, Inc. vs Republic Services, Inc.: A Gross Profit Performance Breakdown
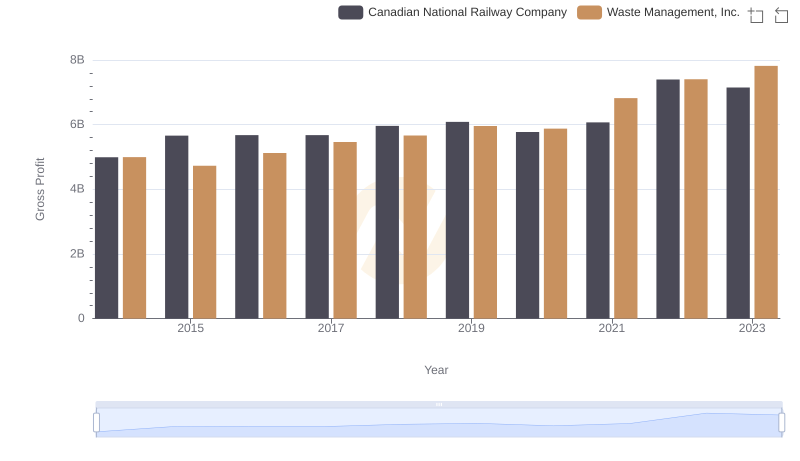
Who Generates Higher Gross Profit? Waste Management, Inc. or Canadian National Railway Company
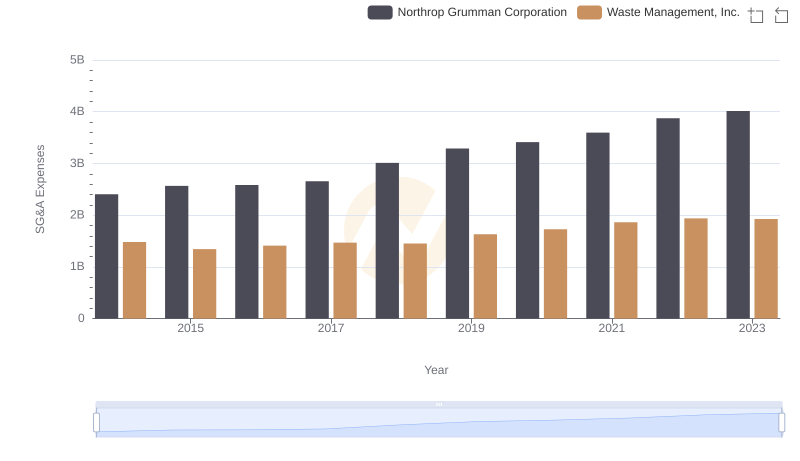
Waste Management, Inc. vs Northrop Grumman Corporation: SG&A Expense Trends
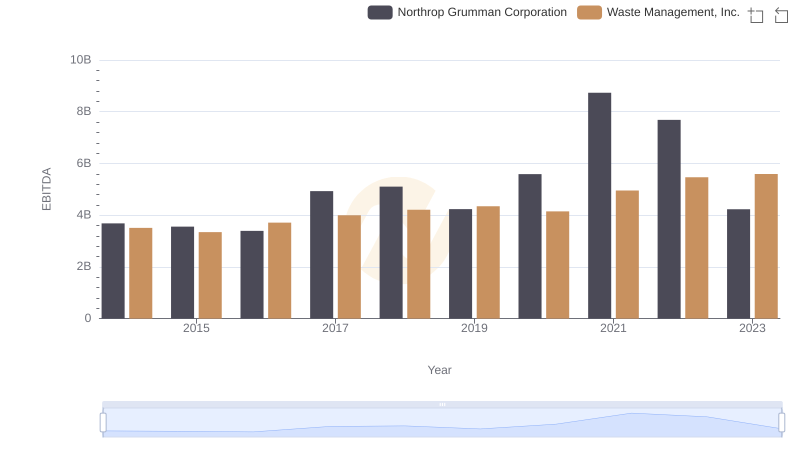
Waste Management, Inc. and Northrop Grumman Corporation: A Detailed Examination of EBITDA Performance