| __timestamp | Norfolk Southern Corporation | Waste Management, Inc. |
|---|---|---|
| Wednesday, January 1, 2014 | 7109000000 | 9002000000 |
| Thursday, January 1, 2015 | 6651000000 | 8231000000 |
| Friday, January 1, 2016 | 6015000000 | 8486000000 |
| Sunday, January 1, 2017 | 6224000000 | 9021000000 |
| Monday, January 1, 2018 | 6844000000 | 9249000000 |
| Tuesday, January 1, 2019 | 6567000000 | 9496000000 |
| Wednesday, January 1, 2020 | 5749000000 | 9341000000 |
| Friday, January 1, 2021 | 6148000000 | 11111000000 |
| Saturday, January 1, 2022 | 7223000000 | 12294000000 |
| Sunday, January 1, 2023 | 6774000000 | 12606000000 |
| Monday, January 1, 2024 | 7580000000 | 13383000000 |
Igniting the spark of knowledge
In the ever-evolving landscape of American industry, Waste Management, Inc. and Norfolk Southern Corporation stand as titans in their respective fields. Over the past decade, from 2014 to 2023, these companies have navigated the complexities of cost management with varying strategies and outcomes.
Waste Management, Inc. has demonstrated a robust upward trajectory in its cost of revenue, increasing by approximately 40% over the period. This growth reflects the company's strategic investments in infrastructure and technology, enabling it to handle increased waste volumes efficiently.
Conversely, Norfolk Southern Corporation experienced a more volatile path, with a notable dip in 2020, likely due to pandemic-related disruptions. However, by 2022, the company rebounded, achieving a 26% increase from its lowest point in 2020. This resilience underscores its adaptability in the face of economic challenges.
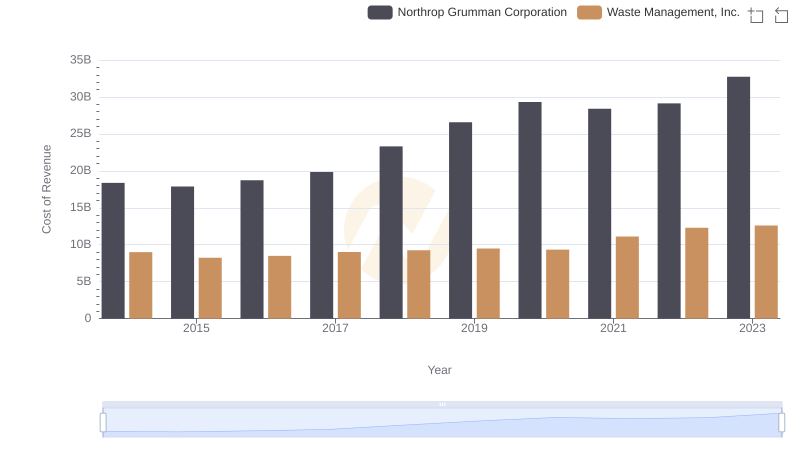
Cost Insights: Breaking Down Waste Management, Inc. and Northrop Grumman Corporation's Expenses
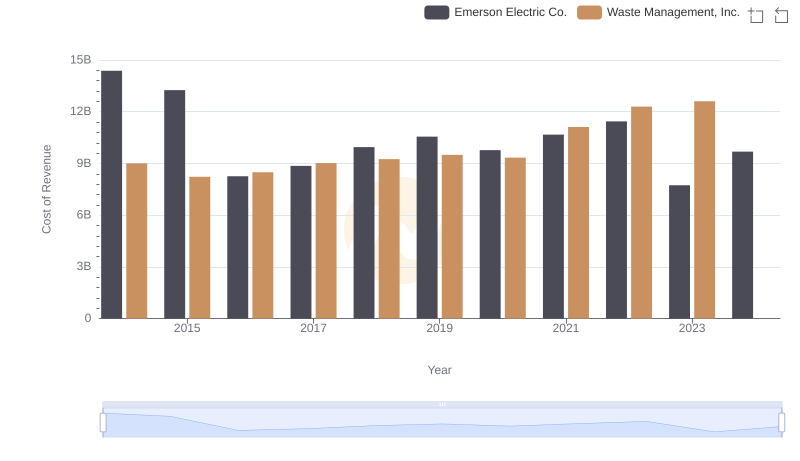
Cost of Revenue Trends: Waste Management, Inc. vs Emerson Electric Co.
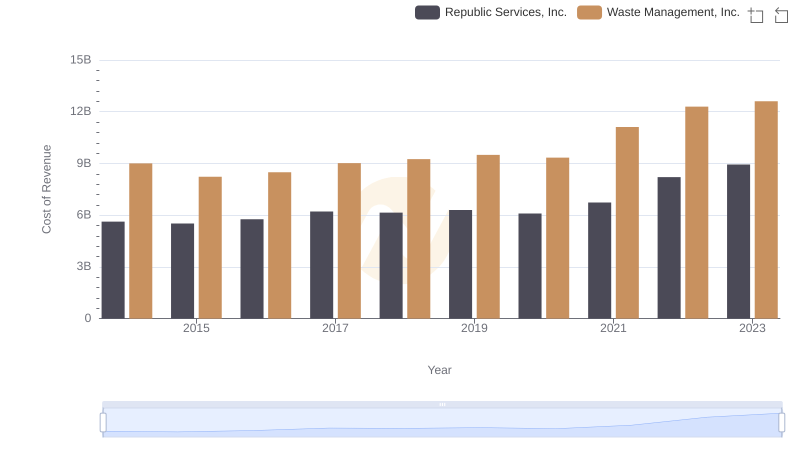
Analyzing Cost of Revenue: Waste Management, Inc. and Republic Services, Inc.
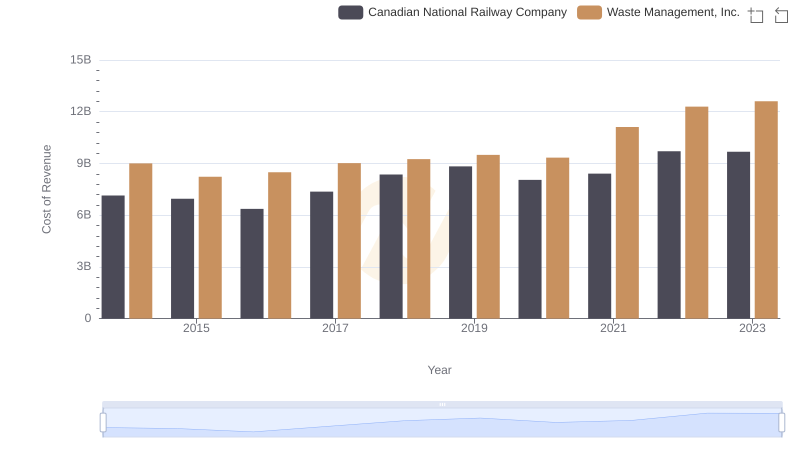
Waste Management, Inc. vs Canadian National Railway Company: Efficiency in Cost of Revenue Explored
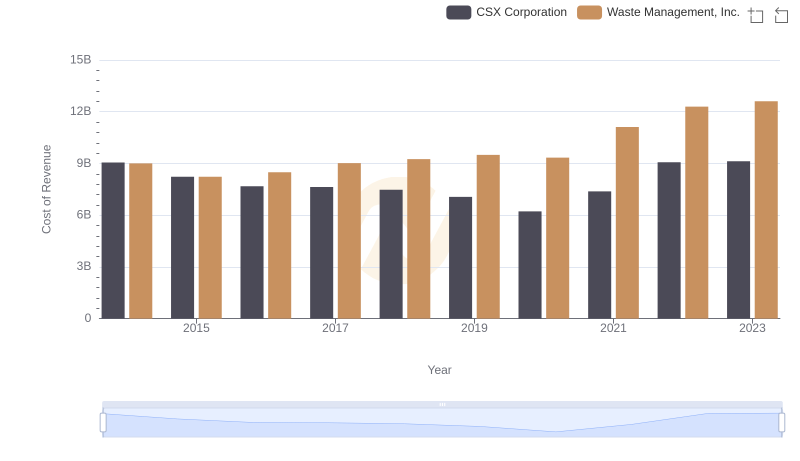
Cost of Revenue Comparison: Waste Management, Inc. vs CSX Corporation
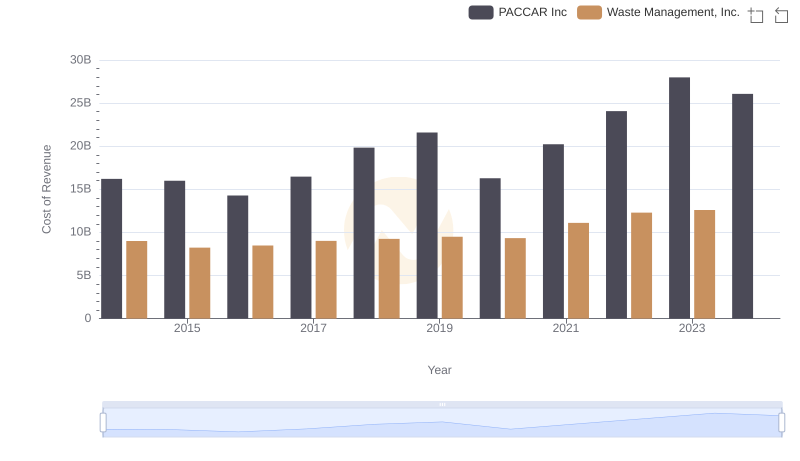
Waste Management, Inc. vs PACCAR Inc: Efficiency in Cost of Revenue Explored
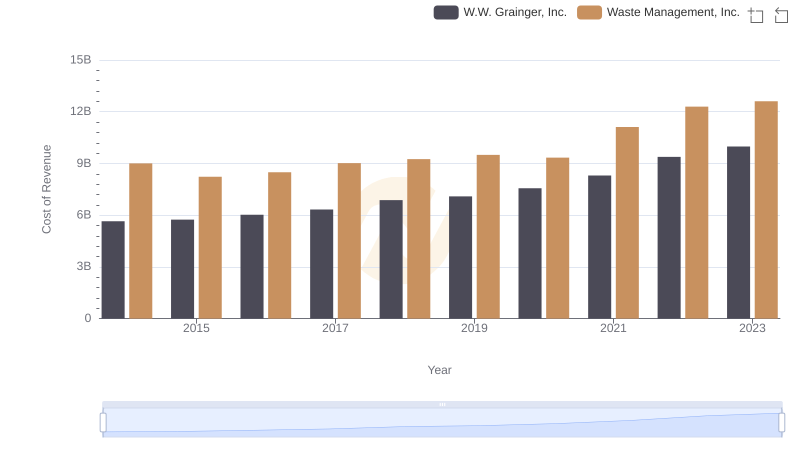
Waste Management, Inc. vs W.W. Grainger, Inc.: Efficiency in Cost of Revenue Explored
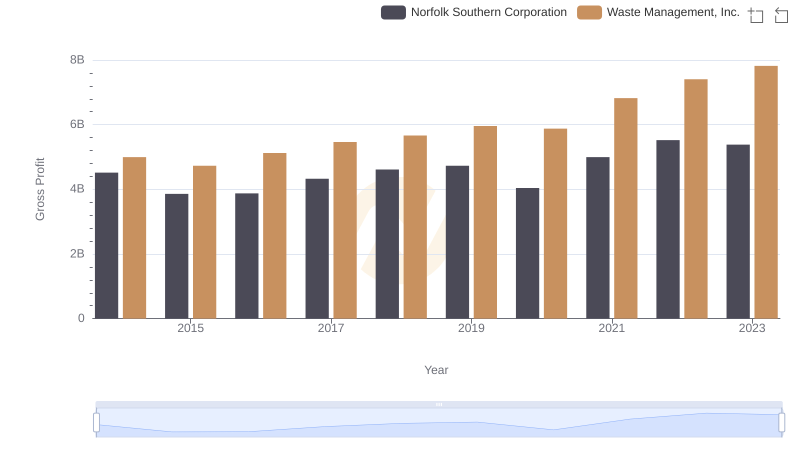
Gross Profit Analysis: Comparing Waste Management, Inc. and Norfolk Southern Corporation
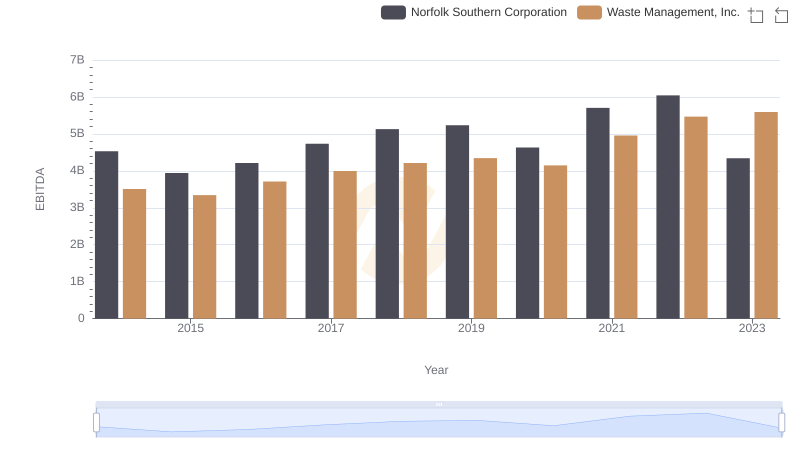
Waste Management, Inc. and Norfolk Southern Corporation: A Detailed Examination of EBITDA Performance