| __timestamp | Lennox International Inc. | Waste Connections, Inc. |
|---|---|---|
| Wednesday, January 1, 2014 | 3367400000 | 2079166000 |
| Thursday, January 1, 2015 | 3467400000 | 2117287000 |
| Friday, January 1, 2016 | 3641600000 | 3375863000 |
| Sunday, January 1, 2017 | 3839600000 | 4630488000 |
| Monday, January 1, 2018 | 3883900000 | 4922941000 |
| Tuesday, January 1, 2019 | 3807200000 | 5388679000 |
| Wednesday, January 1, 2020 | 3634100000 | 5445990000 |
| Friday, January 1, 2021 | 4194100000 | 6151361000 |
| Saturday, January 1, 2022 | 4718400000 | 7211859000 |
| Sunday, January 1, 2023 | 4981900000 | 8021951000 |
| Monday, January 1, 2024 | 5341300000 | 8919591000 |
Unleashing the power of data
In the competitive landscape of the waste management and HVAC industries, Waste Connections, Inc. and Lennox International Inc. have shown remarkable revenue trajectories over the past decade. Since 2014, Waste Connections has experienced a robust growth, with its revenue surging by nearly 286%, reaching approximately $8 billion by 2023. This impressive growth highlights the company's strategic expansions and acquisitions.
On the other hand, Lennox International Inc., a leader in climate control solutions, has demonstrated steady growth, with its revenue increasing by about 59% over the same period, reaching around $5 billion in 2023. This consistent performance underscores Lennox's resilience and adaptability in a fluctuating market.
While Waste Connections continues to expand its market share aggressively, Lennox's steady growth reflects its strong brand loyalty and innovation in product offerings. Notably, data for Waste Connections in 2024 is missing, indicating potential updates or changes in reporting.
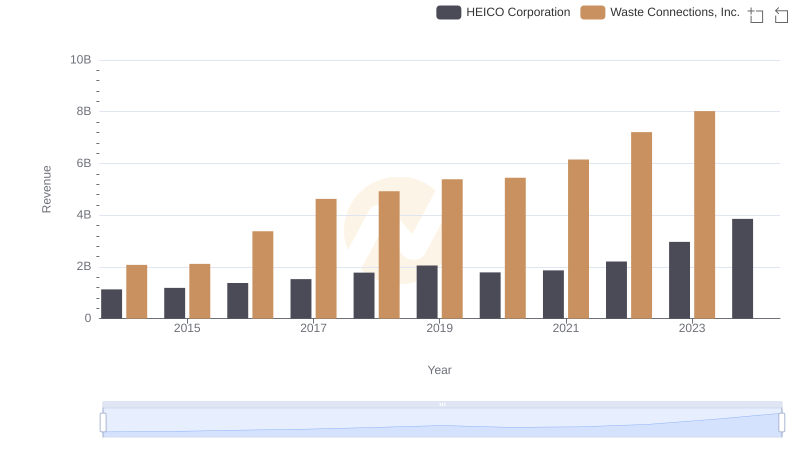
Waste Connections, Inc. vs HEICO Corporation: Examining Key Revenue Metrics
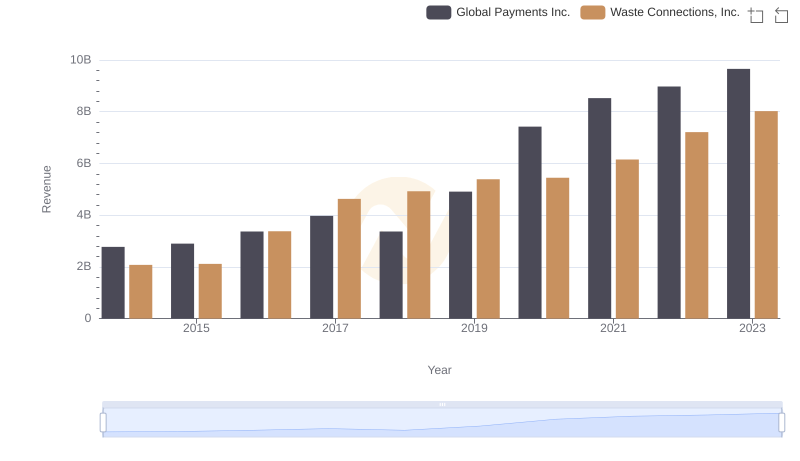
Breaking Down Revenue Trends: Waste Connections, Inc. vs Global Payments Inc.
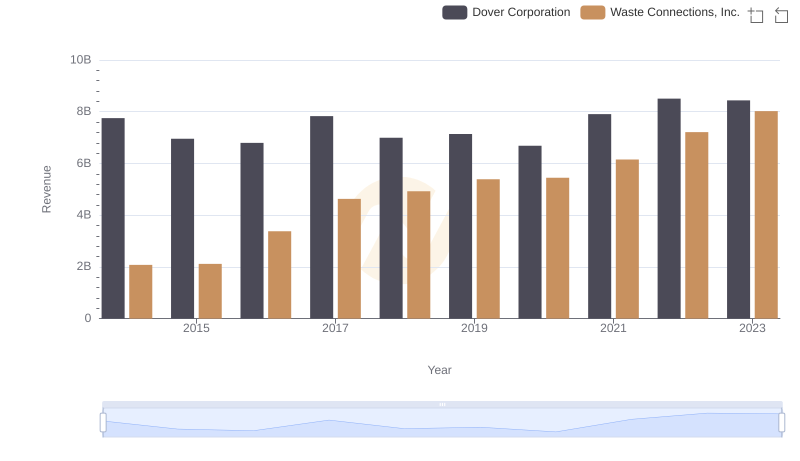
Revenue Showdown: Waste Connections, Inc. vs Dover Corporation
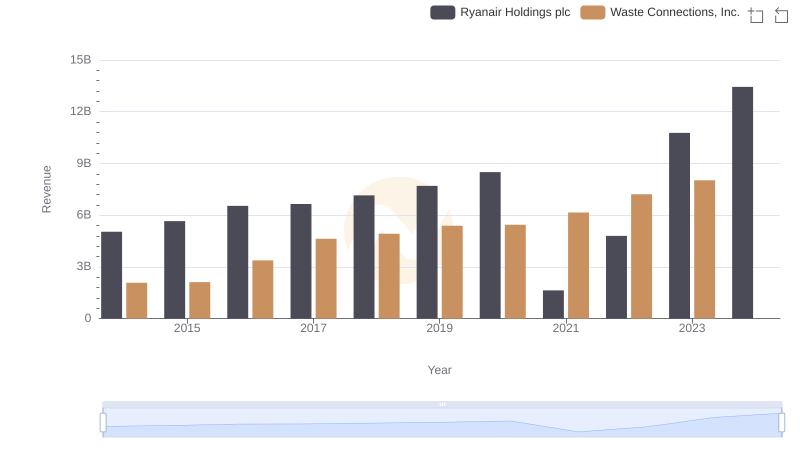
Waste Connections, Inc. vs Ryanair Holdings plc: Examining Key Revenue Metrics
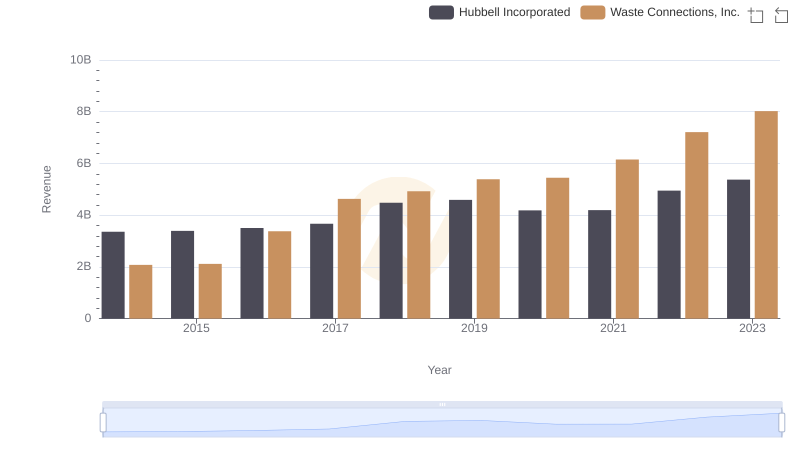
Annual Revenue Comparison: Waste Connections, Inc. vs Hubbell Incorporated
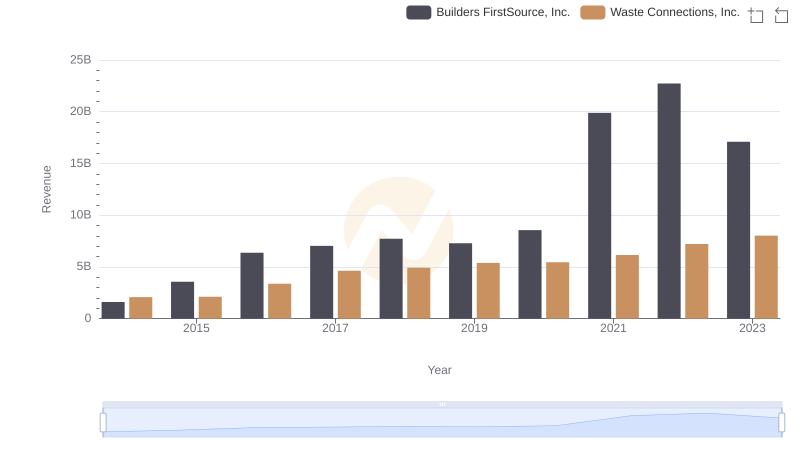
Who Generates More Revenue? Waste Connections, Inc. or Builders FirstSource, Inc.
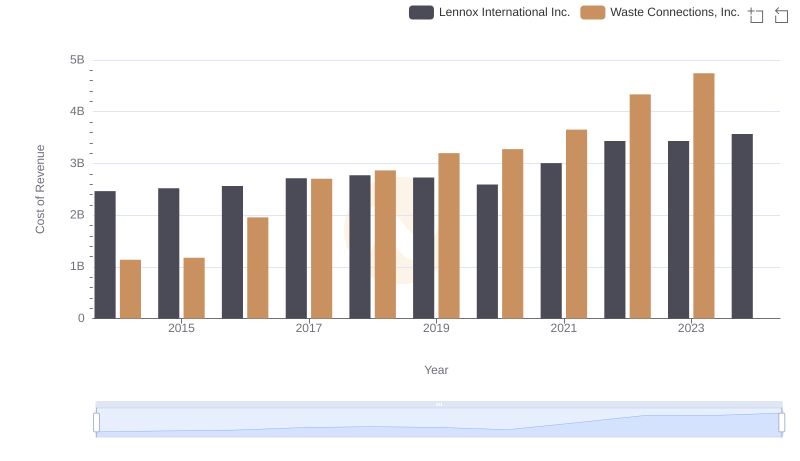
Waste Connections, Inc. vs Lennox International Inc.: Efficiency in Cost of Revenue Explored
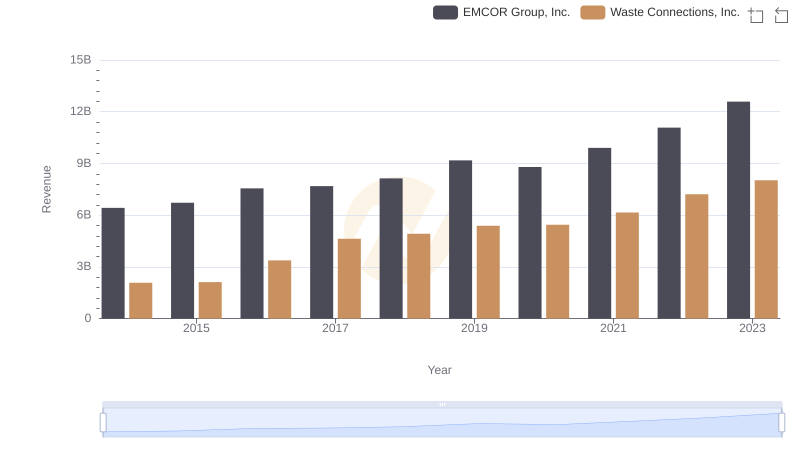
Breaking Down Revenue Trends: Waste Connections, Inc. vs EMCOR Group, Inc.
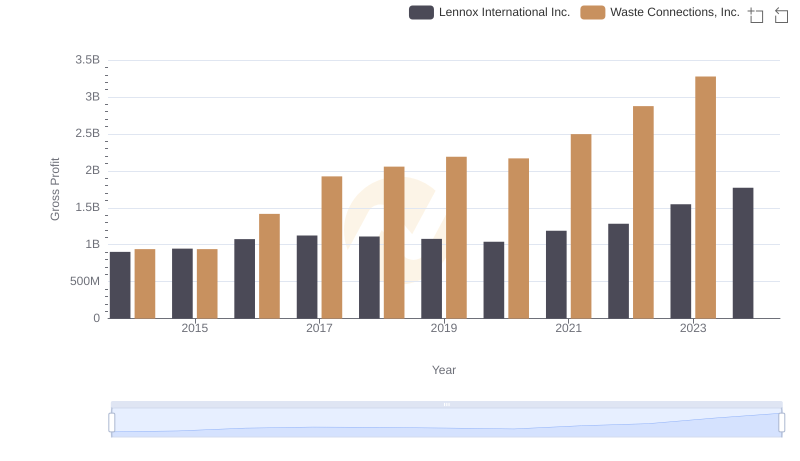
Who Generates Higher Gross Profit? Waste Connections, Inc. or Lennox International Inc.
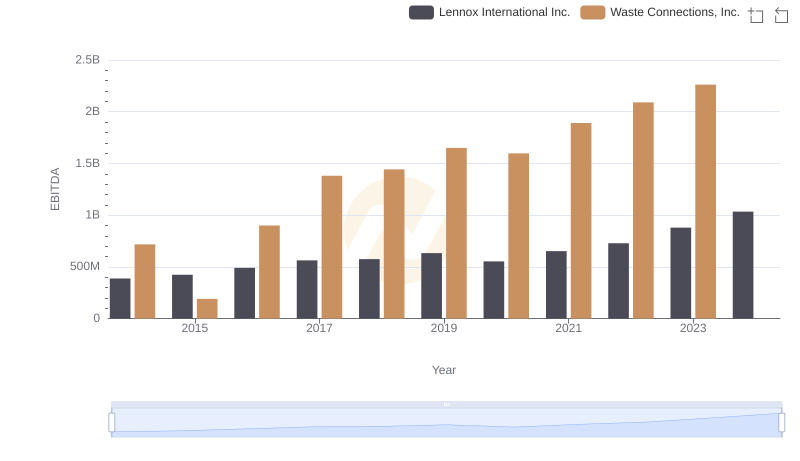
A Side-by-Side Analysis of EBITDA: Waste Connections, Inc. and Lennox International Inc.