| __timestamp | IDEX Corporation | Waste Connections, Inc. |
|---|---|---|
| Wednesday, January 1, 2014 | 504019000 | 717805000 |
| Thursday, January 1, 2015 | 505071000 | 191002871 |
| Friday, January 1, 2016 | 507871000 | 900371894 |
| Sunday, January 1, 2017 | 591033000 | 1380632000 |
| Monday, January 1, 2018 | 657092000 | 1442229014 |
| Tuesday, January 1, 2019 | 647793000 | 1650754605 |
| Wednesday, January 1, 2020 | 604602000 | 1597555000 |
| Friday, January 1, 2021 | 720500000 | 1891001000 |
| Saturday, January 1, 2022 | 909800000 | 2090554149 |
| Sunday, January 1, 2023 | 964100000 | 2261354000 |
| Monday, January 1, 2024 | 677200000 | 2389779000 |
Data in motion
In the competitive landscape of industrial services, Waste Connections, Inc. and IDEX Corporation have showcased remarkable EBITDA growth over the past decade. From 2014 to 2023, Waste Connections, Inc. has consistently outperformed, with a staggering 215% increase in EBITDA, reaching over $2.26 billion in 2023. Meanwhile, IDEX Corporation has also demonstrated robust growth, achieving a 91% rise, culminating in nearly $964 million in the same year.
This performance highlights Waste Connections, Inc.'s strategic expansion and operational efficiency, particularly evident in the significant leap from 2015 to 2017, where EBITDA nearly doubled. IDEX Corporation, while growing at a steadier pace, has shown resilience and adaptability in a dynamic market. As we look to the future, these trends underscore the importance of strategic investments and market positioning in driving financial success.
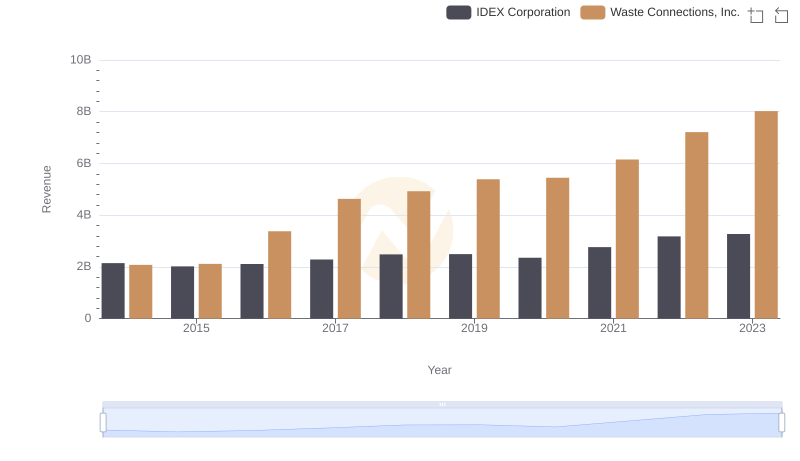
Revenue Insights: Waste Connections, Inc. and IDEX Corporation Performance Compared
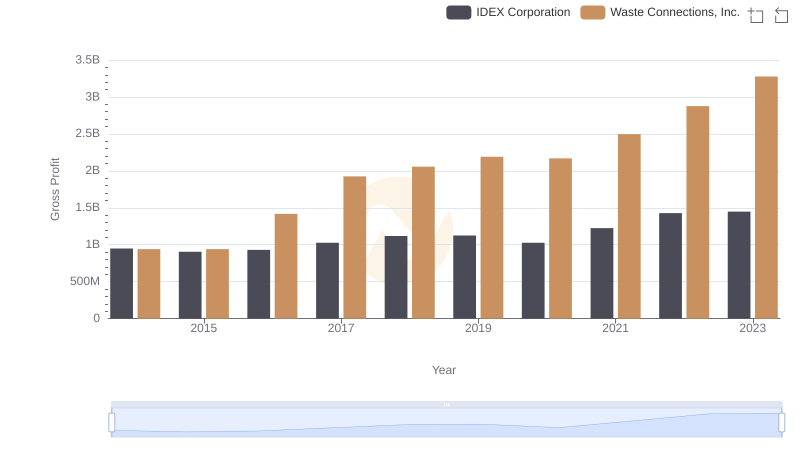
Gross Profit Comparison: Waste Connections, Inc. and IDEX Corporation Trends
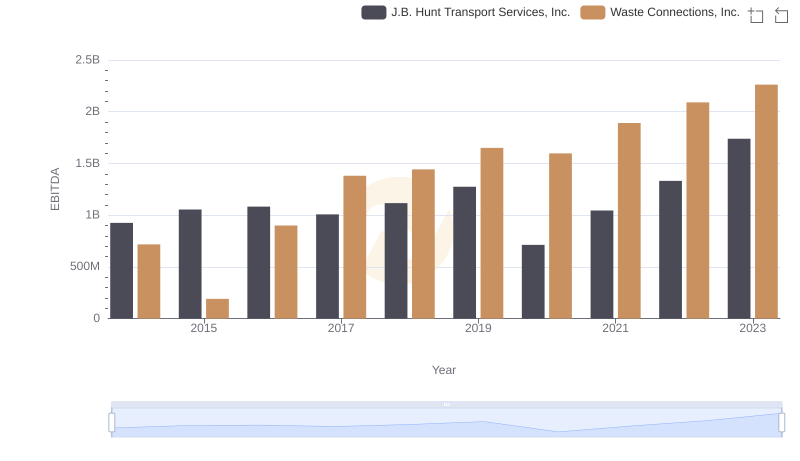
Waste Connections, Inc. and J.B. Hunt Transport Services, Inc.: A Detailed Examination of EBITDA Performance

Waste Connections, Inc. and IDEX Corporation: SG&A Spending Patterns Compared
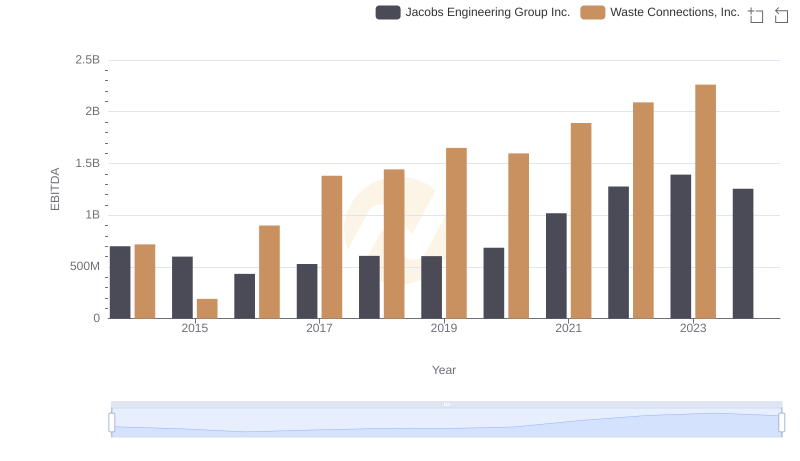
EBITDA Performance Review: Waste Connections, Inc. vs Jacobs Engineering Group Inc.
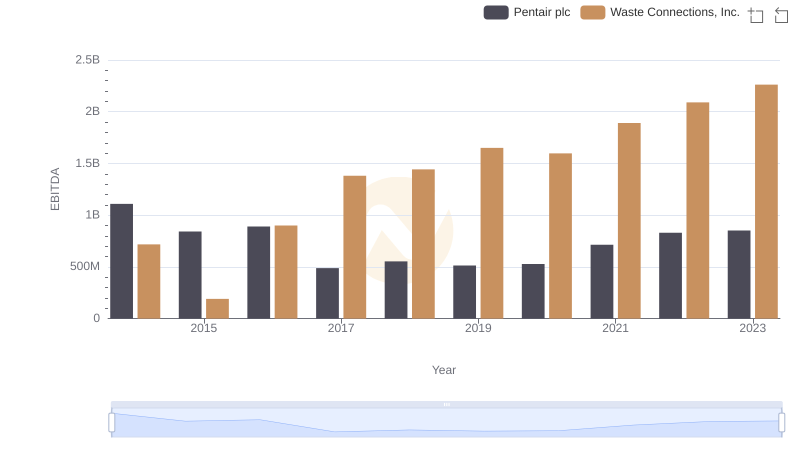
Comprehensive EBITDA Comparison: Waste Connections, Inc. vs Pentair plc
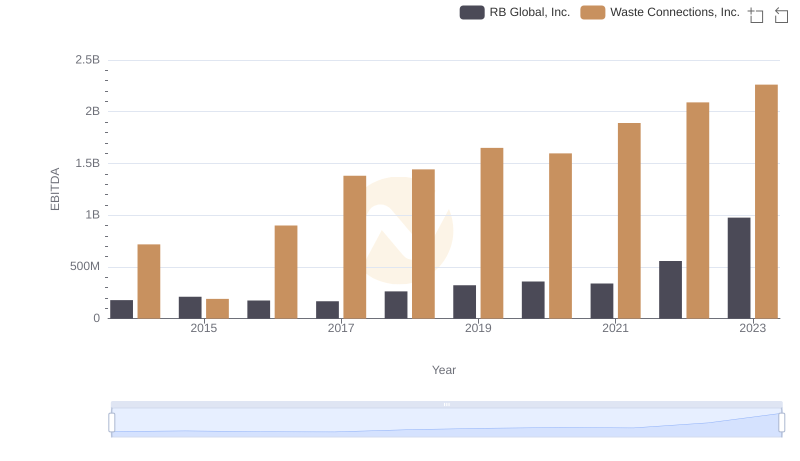
Professional EBITDA Benchmarking: Waste Connections, Inc. vs RB Global, Inc.
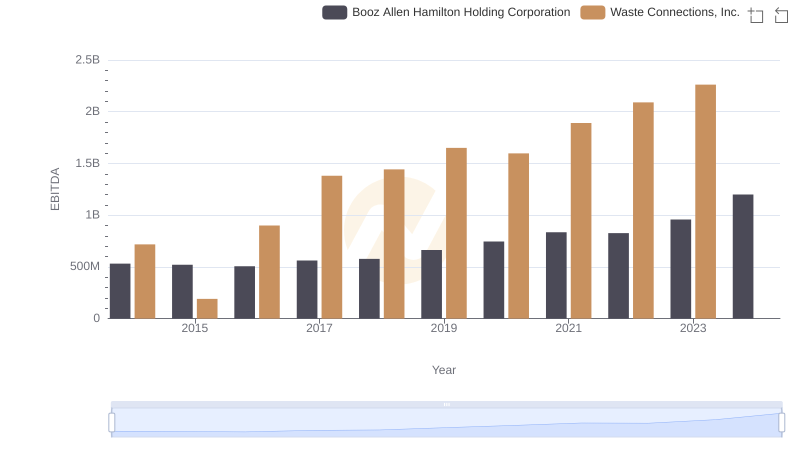
EBITDA Analysis: Evaluating Waste Connections, Inc. Against Booz Allen Hamilton Holding Corporation
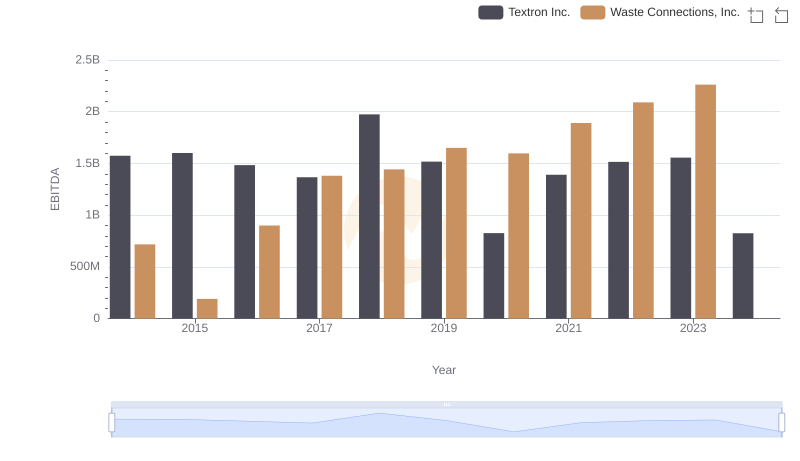
Waste Connections, Inc. and Textron Inc.: A Detailed Examination of EBITDA Performance
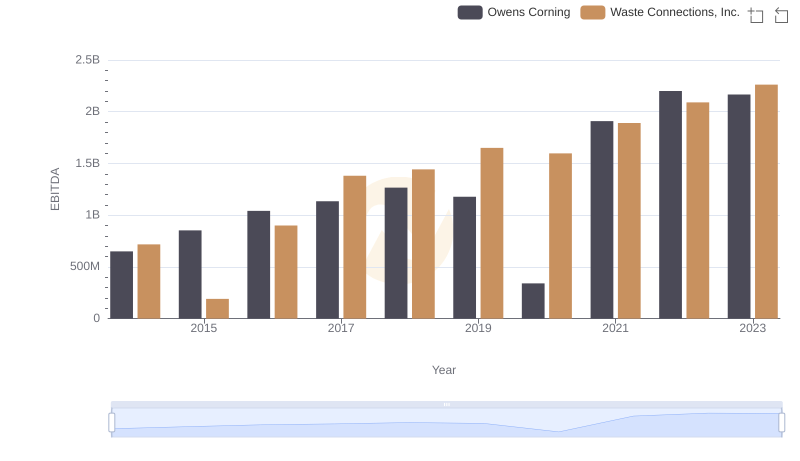
EBITDA Metrics Evaluated: Waste Connections, Inc. vs Owens Corning
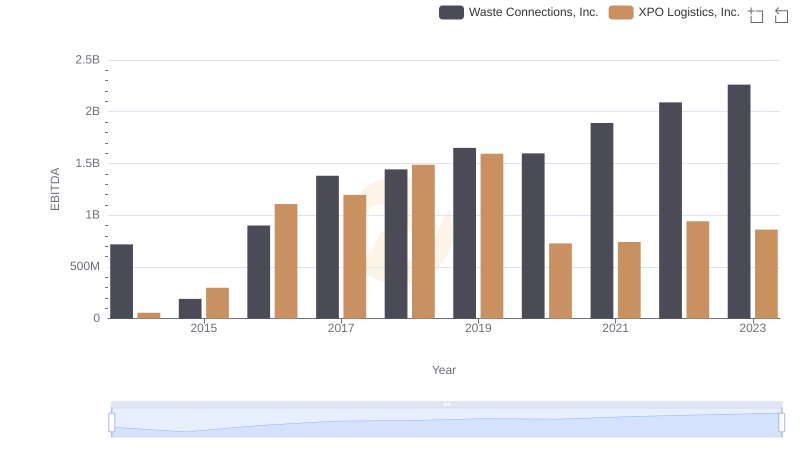
Comprehensive EBITDA Comparison: Waste Connections, Inc. vs XPO Logistics, Inc.