| __timestamp | J.B. Hunt Transport Services, Inc. | Waste Connections, Inc. |
|---|---|---|
| Wednesday, January 1, 2014 | 926038000 | 717805000 |
| Thursday, January 1, 2015 | 1055307000 | 191002871 |
| Friday, January 1, 2016 | 1082601000 | 900371894 |
| Sunday, January 1, 2017 | 1007307000 | 1380632000 |
| Monday, January 1, 2018 | 1116914000 | 1442229014 |
| Tuesday, January 1, 2019 | 1274241000 | 1650754605 |
| Wednesday, January 1, 2020 | 713119000 | 1597555000 |
| Friday, January 1, 2021 | 1045530000 | 1891001000 |
| Saturday, January 1, 2022 | 1331553000 | 2090554149 |
| Sunday, January 1, 2023 | 1738774000 | 2261354000 |
| Monday, January 1, 2024 | 2389779000 |
Data in motion
In the ever-evolving landscape of the transportation and waste management sectors, Waste Connections, Inc. and J.B. Hunt Transport Services, Inc. have emerged as industry leaders. Over the past decade, these companies have demonstrated remarkable EBITDA growth, reflecting their operational efficiency and strategic prowess.
From 2014 to 2023, Waste Connections, Inc. saw its EBITDA surge by approximately 215%, reaching a peak in 2023. This growth underscores the company's robust expansion strategies and its ability to capitalize on market opportunities. Meanwhile, J.B. Hunt Transport Services, Inc. experienced a commendable 88% increase in EBITDA over the same period, highlighting its resilience and adaptability in a competitive market.
This analysis not only showcases the financial health of these giants but also provides insights into their strategic trajectories, offering valuable lessons for stakeholders and investors alike.
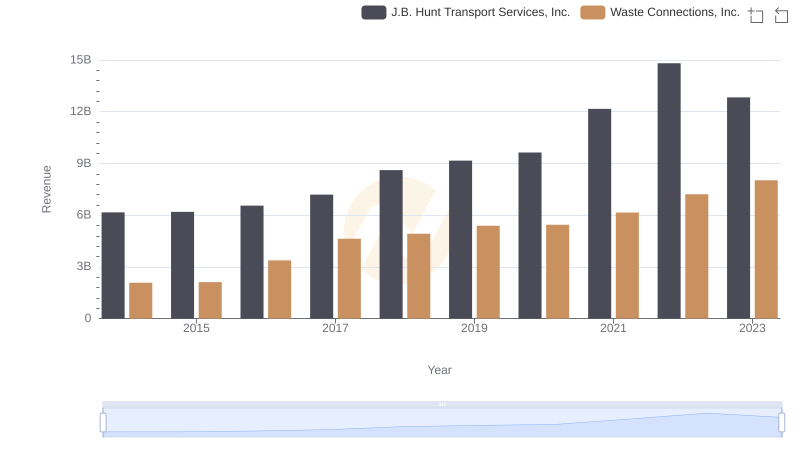
Waste Connections, Inc. or J.B. Hunt Transport Services, Inc.: Who Leads in Yearly Revenue?
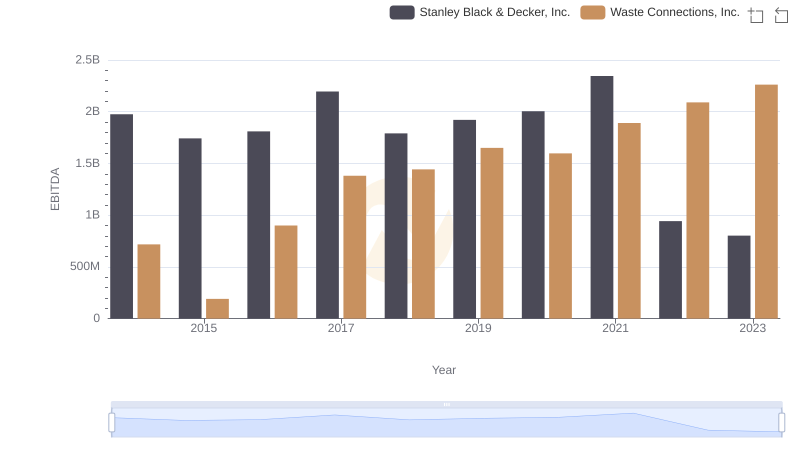
A Professional Review of EBITDA: Waste Connections, Inc. Compared to Stanley Black & Decker, Inc.
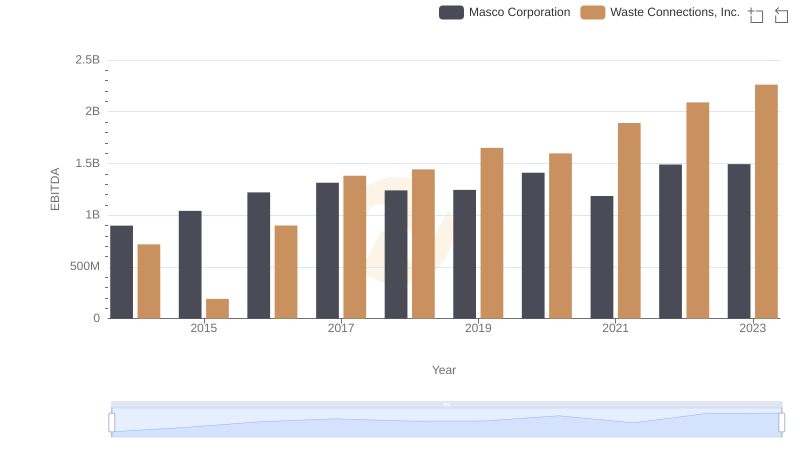
Comparative EBITDA Analysis: Waste Connections, Inc. vs Masco Corporation
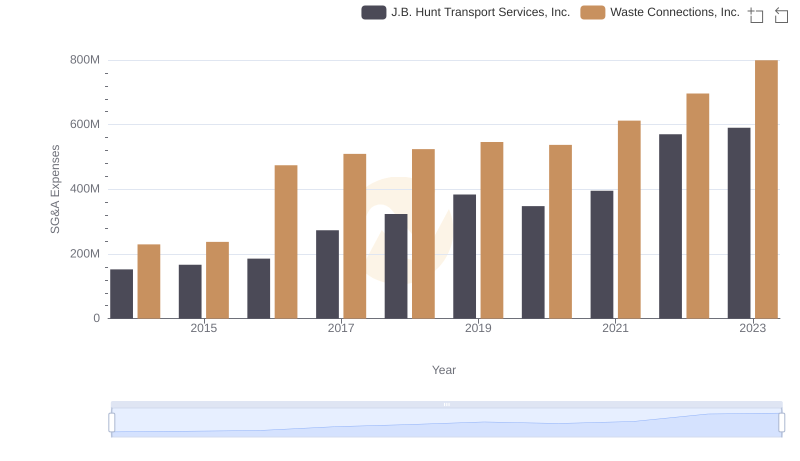
Cost Management Insights: SG&A Expenses for Waste Connections, Inc. and J.B. Hunt Transport Services, Inc.
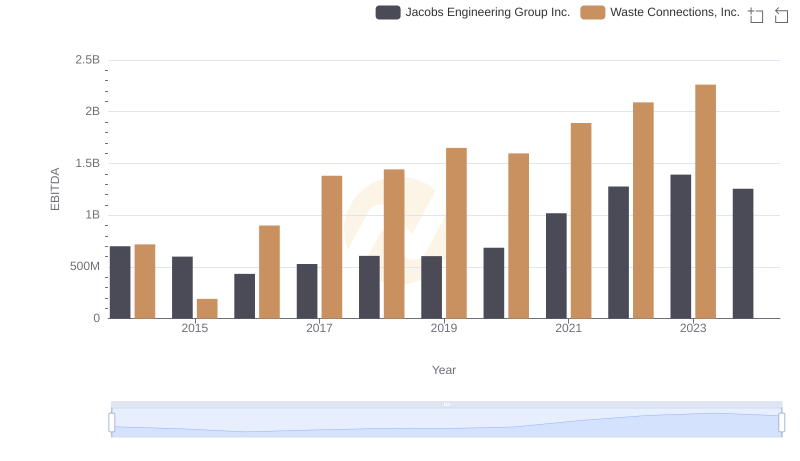
EBITDA Performance Review: Waste Connections, Inc. vs Jacobs Engineering Group Inc.
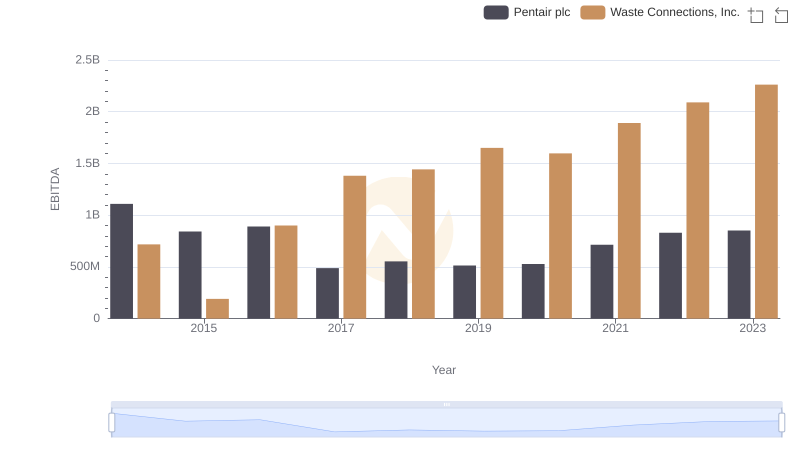
Comprehensive EBITDA Comparison: Waste Connections, Inc. vs Pentair plc
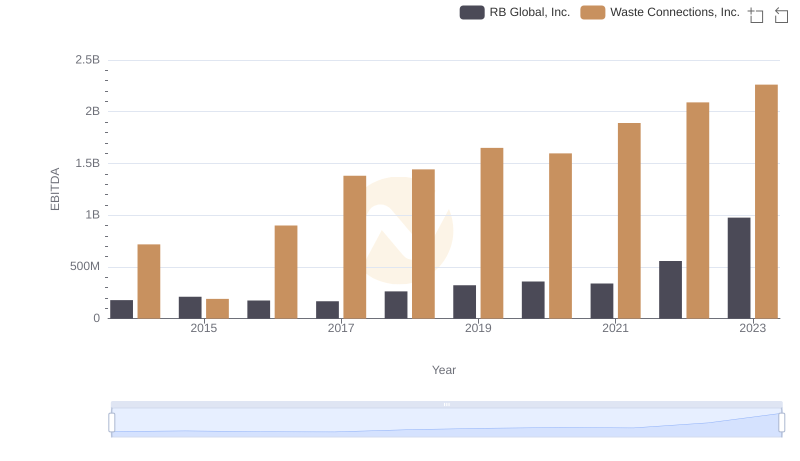
Professional EBITDA Benchmarking: Waste Connections, Inc. vs RB Global, Inc.
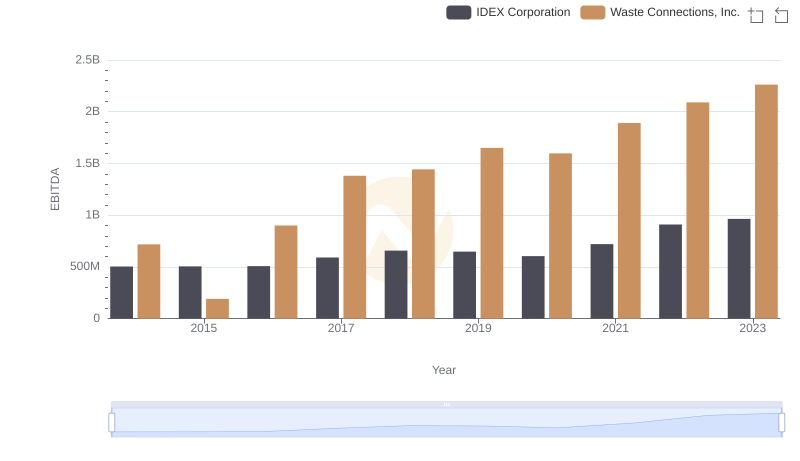
Waste Connections, Inc. vs IDEX Corporation: In-Depth EBITDA Performance Comparison