| __timestamp | Jacobs Engineering Group Inc. | Waste Connections, Inc. |
|---|---|---|
| Wednesday, January 1, 2014 | 699015000 | 717805000 |
| Thursday, January 1, 2015 | 598932000 | 191002871 |
| Friday, January 1, 2016 | 431954000 | 900371894 |
| Sunday, January 1, 2017 | 527765000 | 1380632000 |
| Monday, January 1, 2018 | 606328000 | 1442229014 |
| Tuesday, January 1, 2019 | 604075000 | 1650754605 |
| Wednesday, January 1, 2020 | 685042000 | 1597555000 |
| Friday, January 1, 2021 | 1019116000 | 1891001000 |
| Saturday, January 1, 2022 | 1277649000 | 2090554149 |
| Sunday, January 1, 2023 | 1392039000 | 2261354000 |
| Monday, January 1, 2024 | 1255083000 | 2389779000 |
In pursuit of knowledge
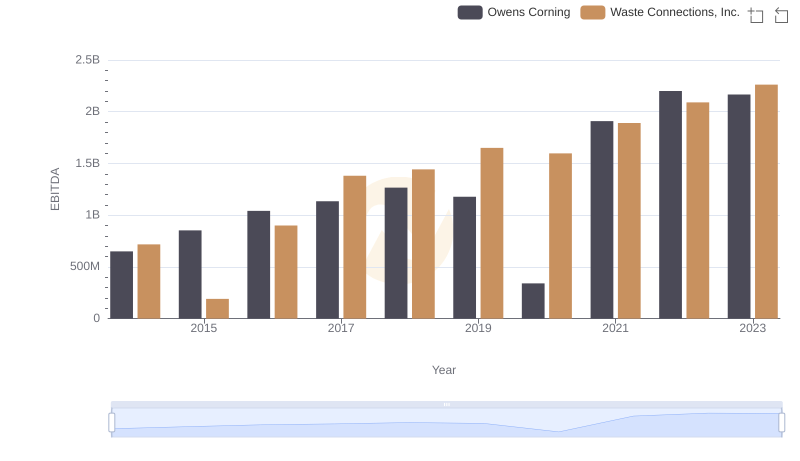
In the ever-evolving landscape of the waste management and engineering sectors, Waste Connections, Inc. and Jacobs Engineering Group Inc. have demonstrated remarkable EBITDA growth over the past decade. From 2014 to 2023, Waste Connections, Inc. has consistently outperformed, with a peak EBITDA of approximately $2.26 billion in 2023, marking a staggering 215% increase from its 2015 low. Meanwhile, Jacobs Engineering Group Inc. has shown a steady upward trajectory, achieving a 99% growth in EBITDA, peaking at around $1.39 billion in 2023. This performance underscores the resilience and strategic prowess of these industry leaders. Notably, 2024 data for Waste Connections, Inc. is missing, leaving room for speculation on its future trajectory. As these companies continue to navigate economic challenges, their financial health remains a testament to their robust business models and strategic foresight.
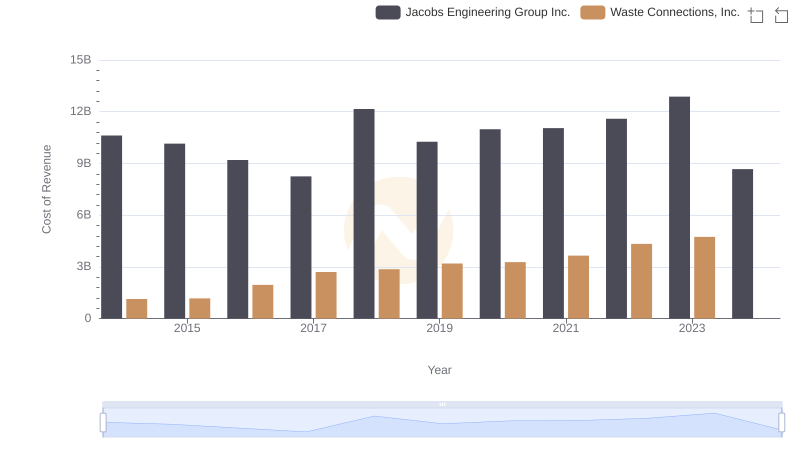
Cost Insights: Breaking Down Waste Connections, Inc. and Jacobs Engineering Group Inc.'s Expenses
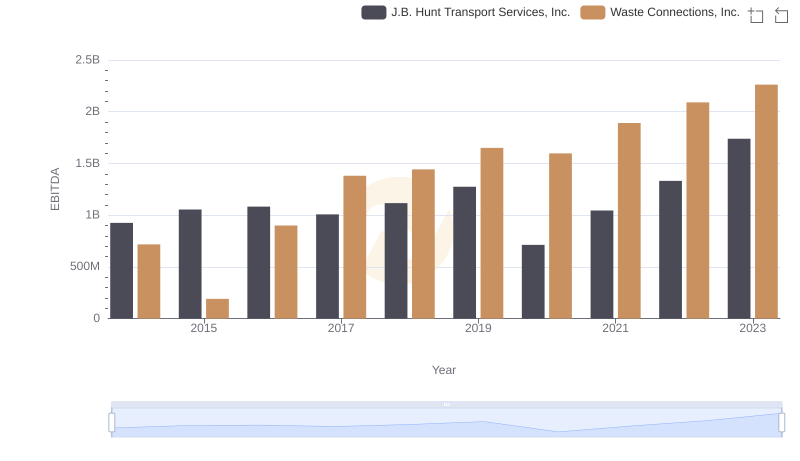
Waste Connections, Inc. and J.B. Hunt Transport Services, Inc.: A Detailed Examination of EBITDA Performance
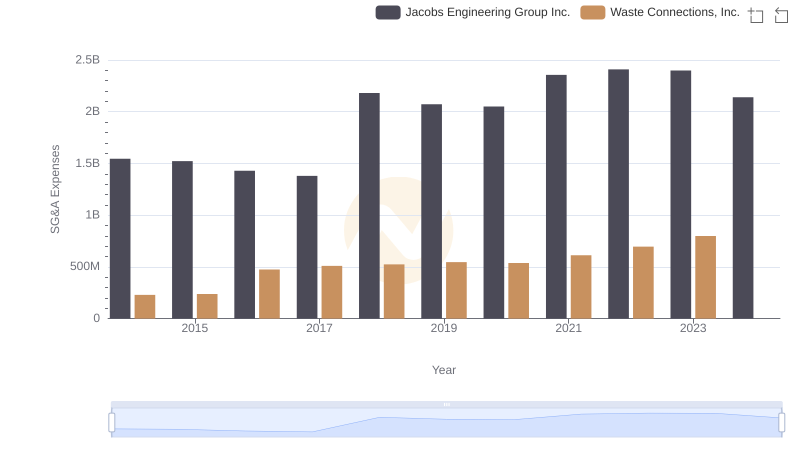
SG&A Efficiency Analysis: Comparing Waste Connections, Inc. and Jacobs Engineering Group Inc.
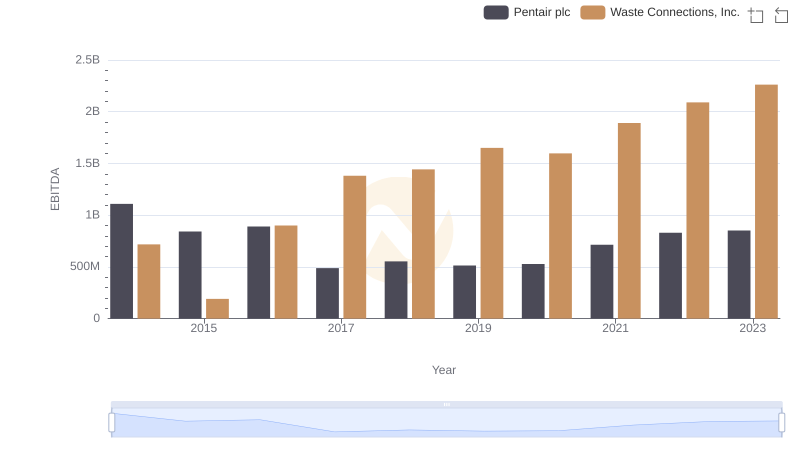
Comprehensive EBITDA Comparison: Waste Connections, Inc. vs Pentair plc
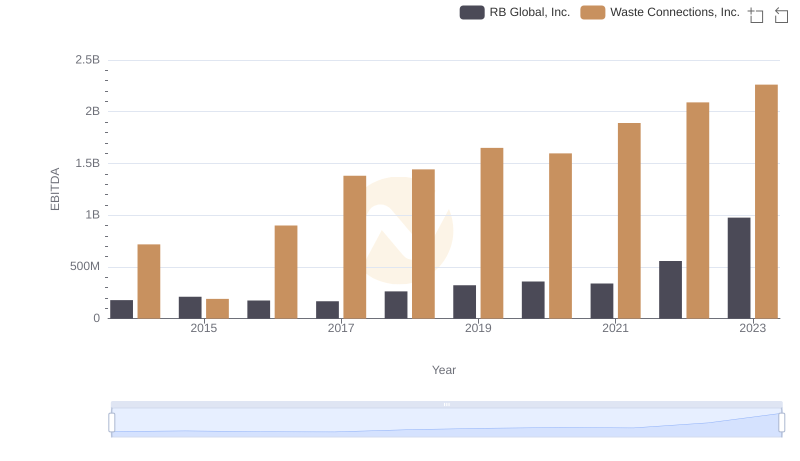
Professional EBITDA Benchmarking: Waste Connections, Inc. vs RB Global, Inc.
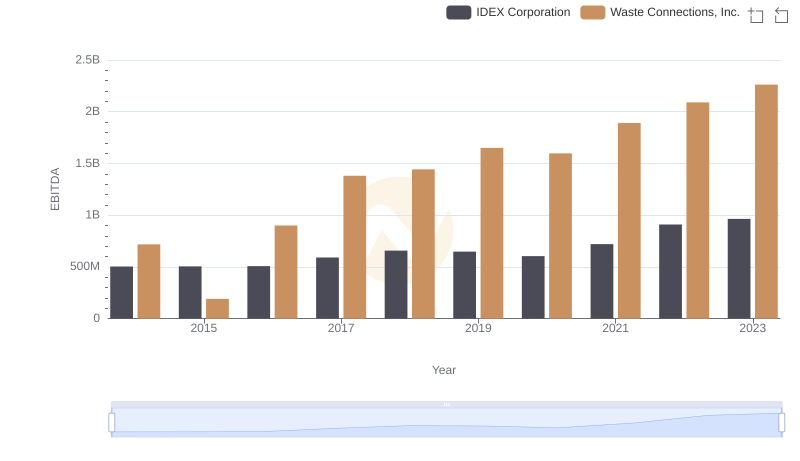
Waste Connections, Inc. vs IDEX Corporation: In-Depth EBITDA Performance Comparison
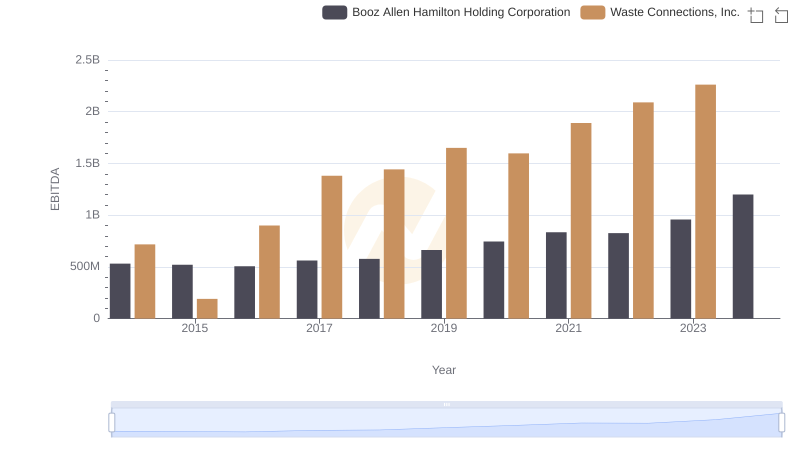
EBITDA Analysis: Evaluating Waste Connections, Inc. Against Booz Allen Hamilton Holding Corporation
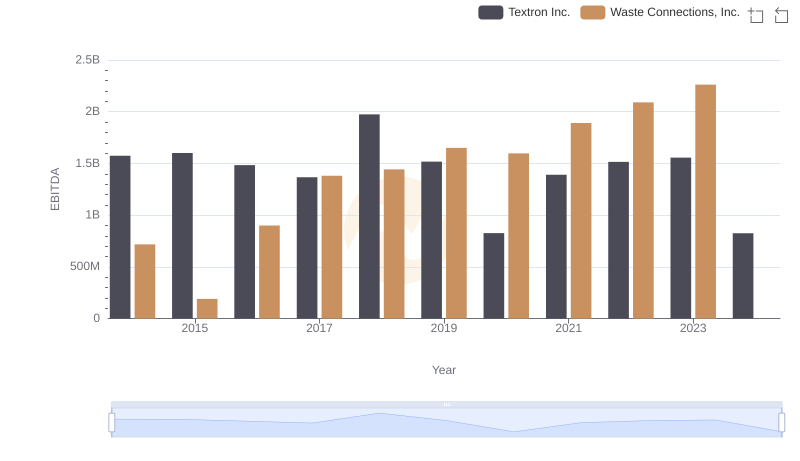
Waste Connections, Inc. and Textron Inc.: A Detailed Examination of EBITDA Performance
EBITDA Metrics Evaluated: Waste Connections, Inc. vs Owens Corning