| __timestamp | Pentair plc | Waste Connections, Inc. |
|---|---|---|
| Wednesday, January 1, 2014 | 1109300000 | 717805000 |
| Thursday, January 1, 2015 | 842400000 | 191002871 |
| Friday, January 1, 2016 | 890400000 | 900371894 |
| Sunday, January 1, 2017 | 488600000 | 1380632000 |
| Monday, January 1, 2018 | 552800000 | 1442229014 |
| Tuesday, January 1, 2019 | 513200000 | 1650754605 |
| Wednesday, January 1, 2020 | 527600000 | 1597555000 |
| Friday, January 1, 2021 | 714400000 | 1891001000 |
| Saturday, January 1, 2022 | 830400000 | 2090554149 |
| Sunday, January 1, 2023 | 852000000 | 2261354000 |
| Monday, January 1, 2024 | 803800000 | 2389779000 |
Data in motion
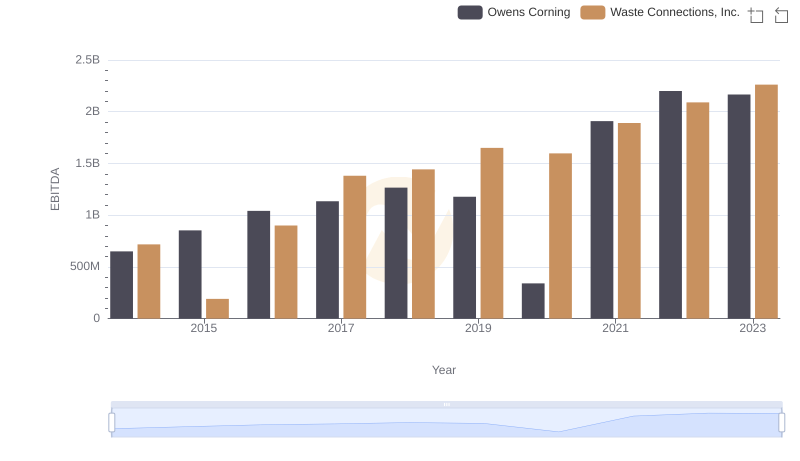
In the ever-evolving landscape of waste management and water solutions, Waste Connections, Inc. and Pentair plc have emerged as industry leaders. Over the past decade, from 2014 to 2023, these companies have showcased contrasting EBITDA trajectories, reflecting their strategic priorities and market dynamics.
Waste Connections, Inc. has demonstrated a robust growth pattern, with its EBITDA surging by approximately 215% from 2014 to 2023. This growth underscores the company's strategic acquisitions and operational efficiencies. In contrast, Pentair plc experienced a more volatile EBITDA trend, with a notable dip in 2017, followed by a gradual recovery, culminating in a 23% increase by 2023 compared to its 2014 figures.
This comparative analysis not only highlights the resilience of Waste Connections, Inc. but also underscores the challenges and recovery strategies employed by Pentair plc in a competitive market.
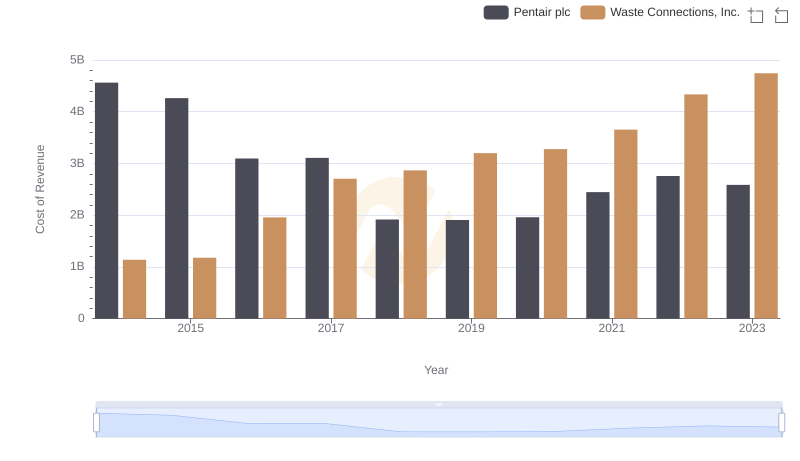
Cost of Revenue Comparison: Waste Connections, Inc. vs Pentair plc
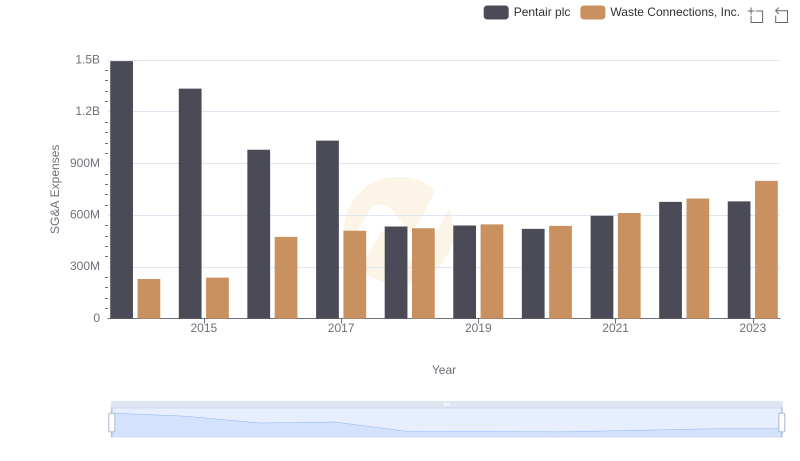
SG&A Efficiency Analysis: Comparing Waste Connections, Inc. and Pentair plc
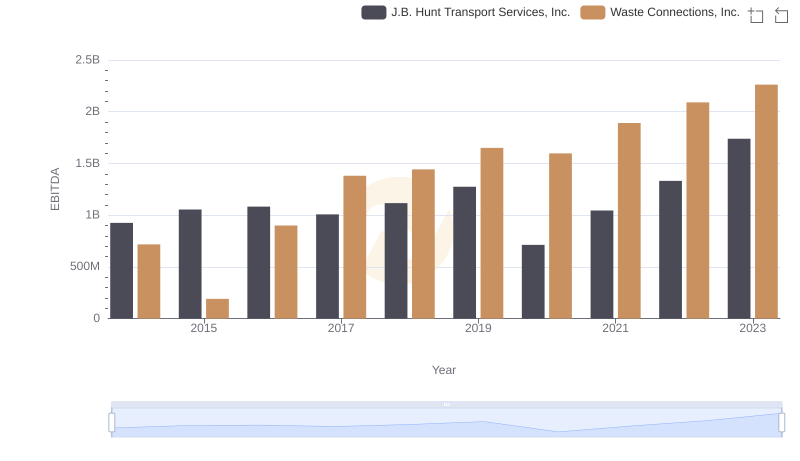
Waste Connections, Inc. and J.B. Hunt Transport Services, Inc.: A Detailed Examination of EBITDA Performance
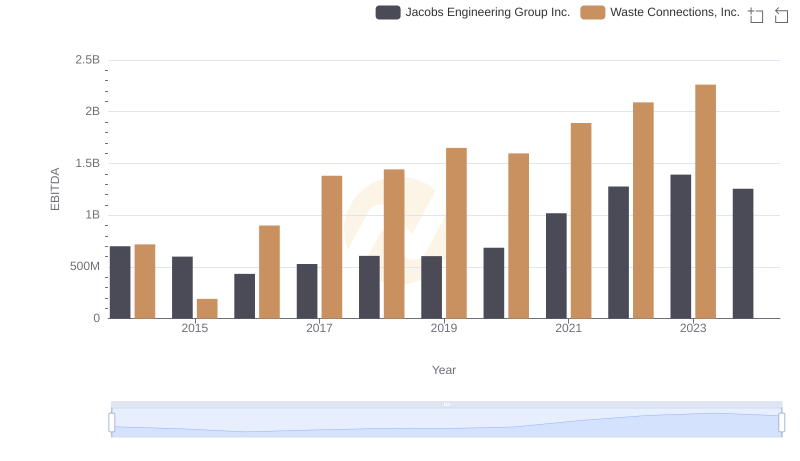
EBITDA Performance Review: Waste Connections, Inc. vs Jacobs Engineering Group Inc.
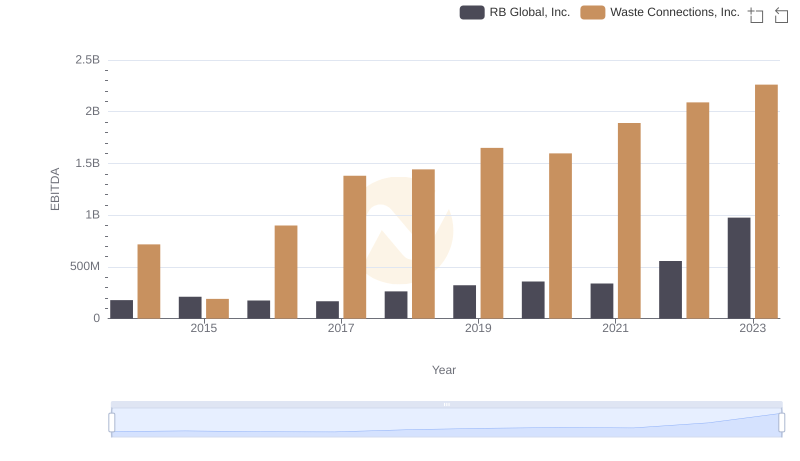
Professional EBITDA Benchmarking: Waste Connections, Inc. vs RB Global, Inc.
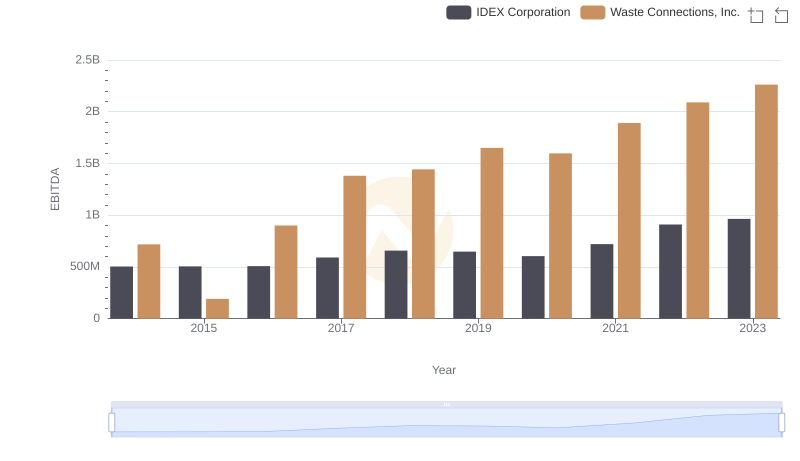
Waste Connections, Inc. vs IDEX Corporation: In-Depth EBITDA Performance Comparison
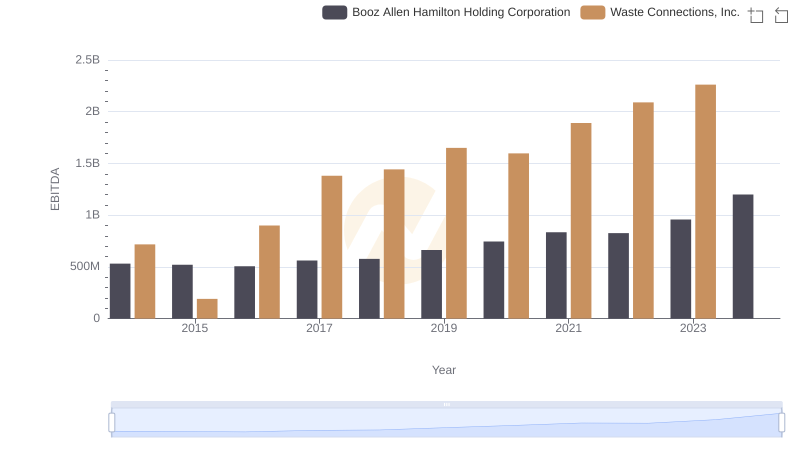
EBITDA Analysis: Evaluating Waste Connections, Inc. Against Booz Allen Hamilton Holding Corporation
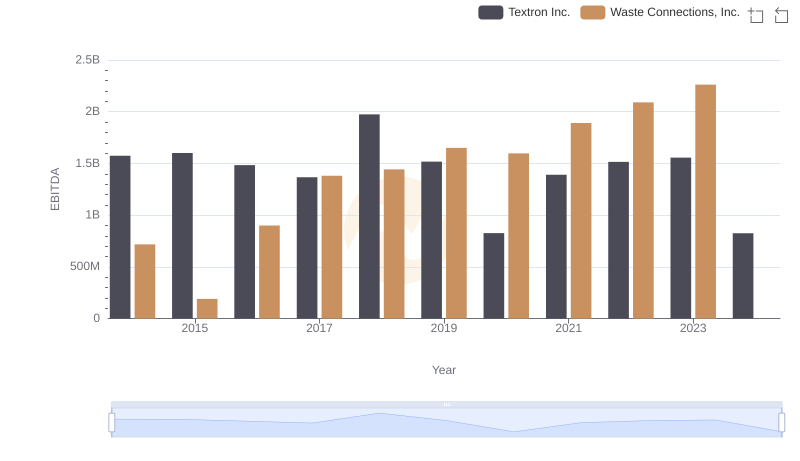
Waste Connections, Inc. and Textron Inc.: A Detailed Examination of EBITDA Performance
EBITDA Metrics Evaluated: Waste Connections, Inc. vs Owens Corning