| __timestamp | Owens Corning | Waste Connections, Inc. |
|---|---|---|
| Wednesday, January 1, 2014 | 650000000 | 717805000 |
| Thursday, January 1, 2015 | 853000000 | 191002871 |
| Friday, January 1, 2016 | 1041000000 | 900371894 |
| Sunday, January 1, 2017 | 1134000000 | 1380632000 |
| Monday, January 1, 2018 | 1266000000 | 1442229014 |
| Tuesday, January 1, 2019 | 1178000000 | 1650754605 |
| Wednesday, January 1, 2020 | 341000000 | 1597555000 |
| Friday, January 1, 2021 | 1909000000 | 1891001000 |
| Saturday, January 1, 2022 | 2200000000 | 2090554149 |
| Sunday, January 1, 2023 | 2166000000 | 2261354000 |
| Monday, January 1, 2024 | 2389779000 |
Infusing magic into the data realm
In the ever-evolving landscape of the waste management and building materials industries, Waste Connections, Inc. and Owens Corning have demonstrated remarkable EBITDA growth over the past decade. From 2014 to 2023, Waste Connections, Inc. saw its EBITDA surge by approximately 215%, reaching a peak of $2.26 billion in 2023. Meanwhile, Owens Corning experienced a robust 233% increase, culminating in an EBITDA of $2.17 billion in the same year.
Despite the economic challenges of 2020, both companies showcased resilience. Waste Connections, Inc. maintained a steady upward trajectory, while Owens Corning rebounded impressively from a dip in 2020. This data underscores the strategic adaptability and operational efficiency of these industry leaders, making them compelling case studies in financial growth and stability.
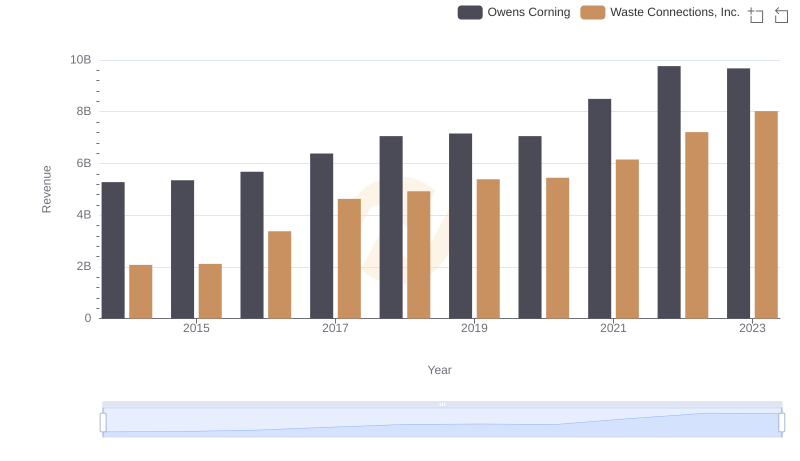
Comparing Revenue Performance: Waste Connections, Inc. or Owens Corning?
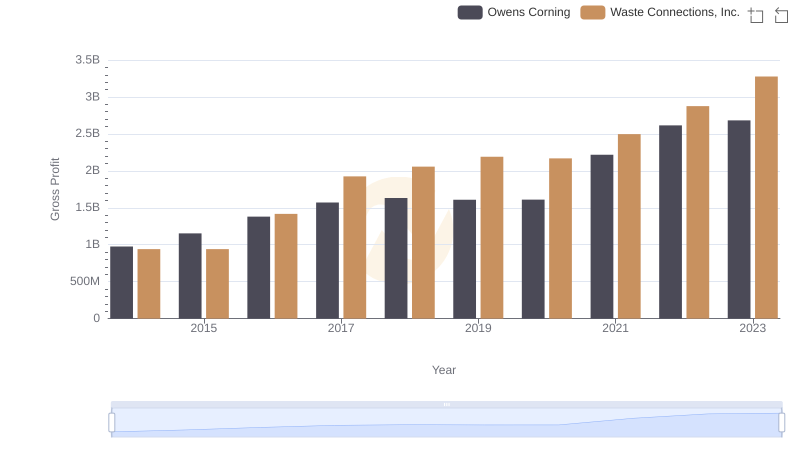
Who Generates Higher Gross Profit? Waste Connections, Inc. or Owens Corning
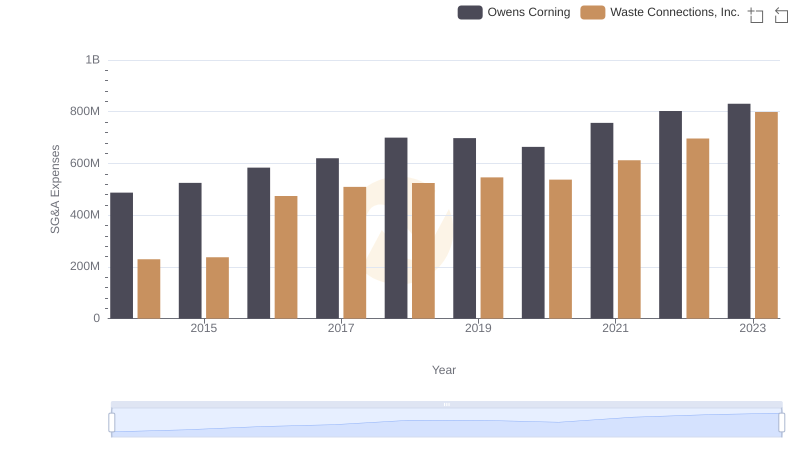
Who Optimizes SG&A Costs Better? Waste Connections, Inc. or Owens Corning
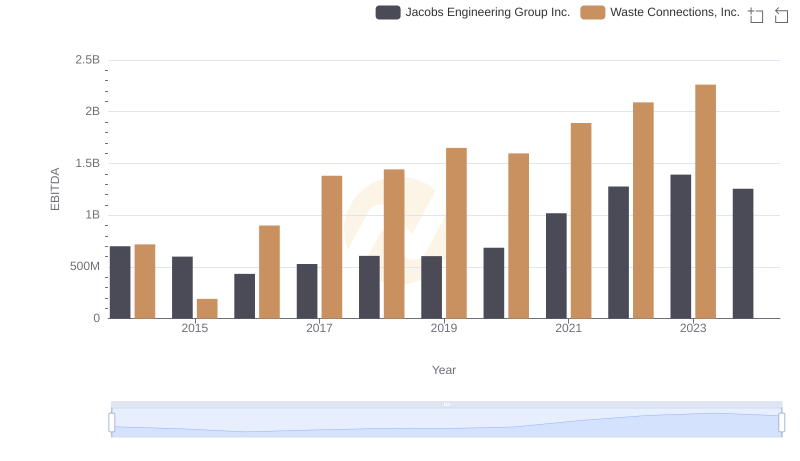
EBITDA Performance Review: Waste Connections, Inc. vs Jacobs Engineering Group Inc.
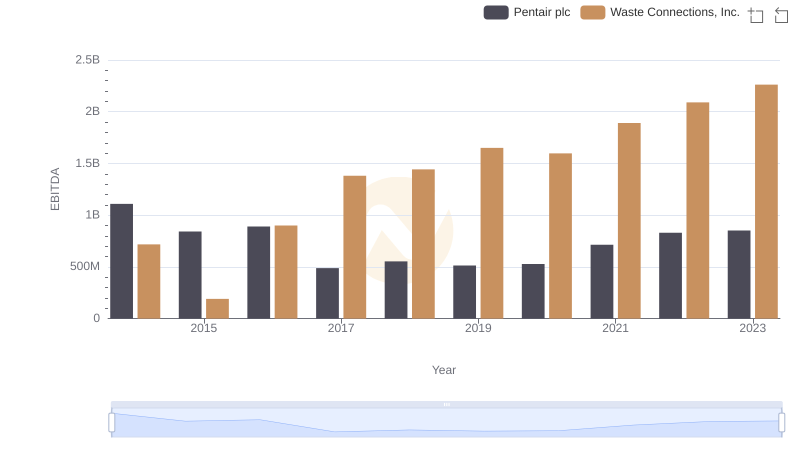
Comprehensive EBITDA Comparison: Waste Connections, Inc. vs Pentair plc
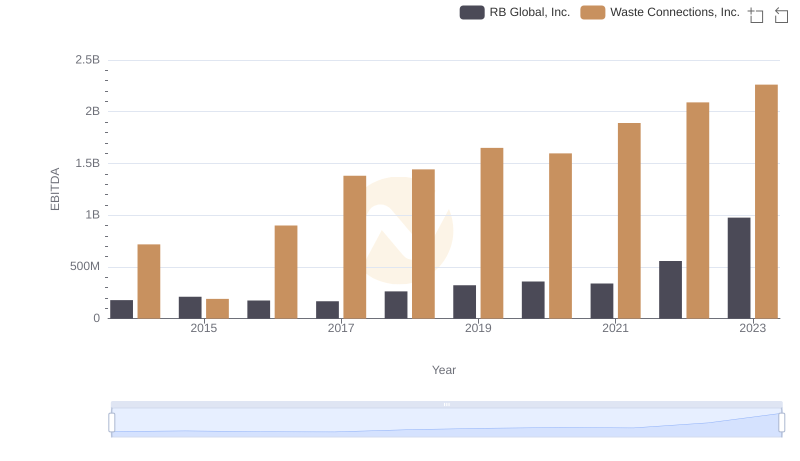
Professional EBITDA Benchmarking: Waste Connections, Inc. vs RB Global, Inc.
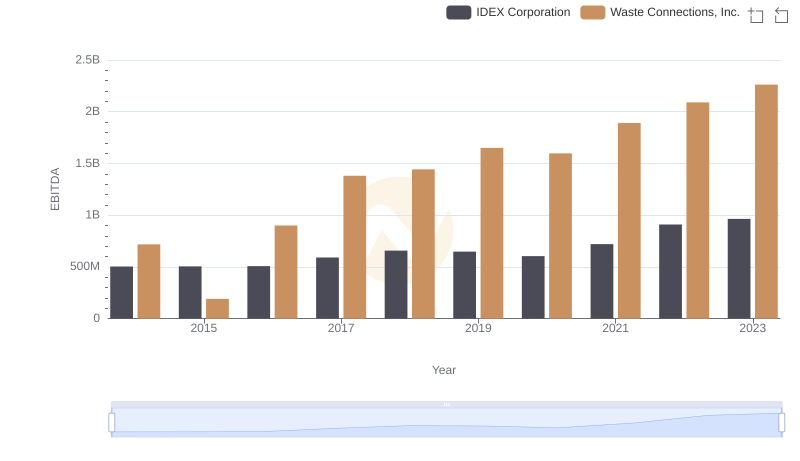
Waste Connections, Inc. vs IDEX Corporation: In-Depth EBITDA Performance Comparison
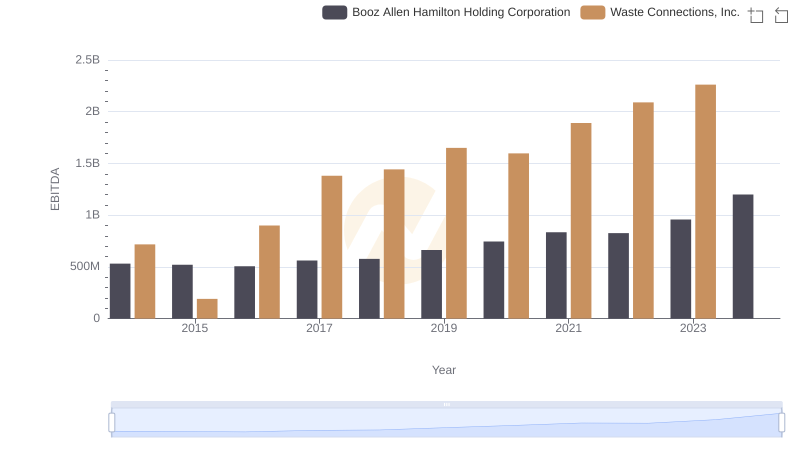
EBITDA Analysis: Evaluating Waste Connections, Inc. Against Booz Allen Hamilton Holding Corporation
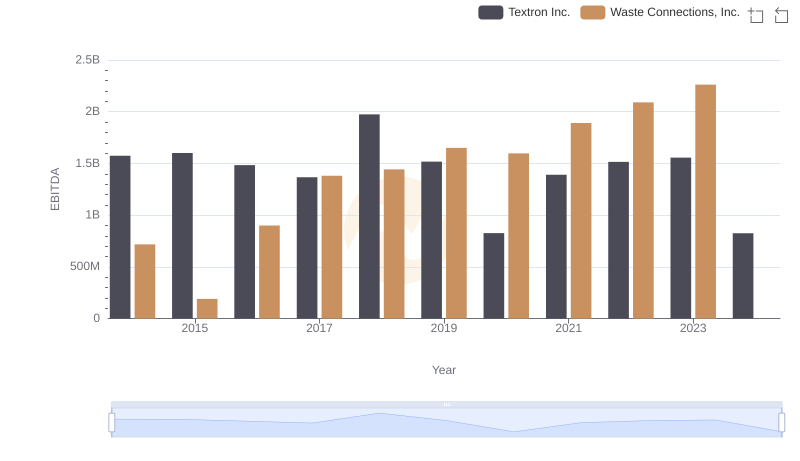
Waste Connections, Inc. and Textron Inc.: A Detailed Examination of EBITDA Performance
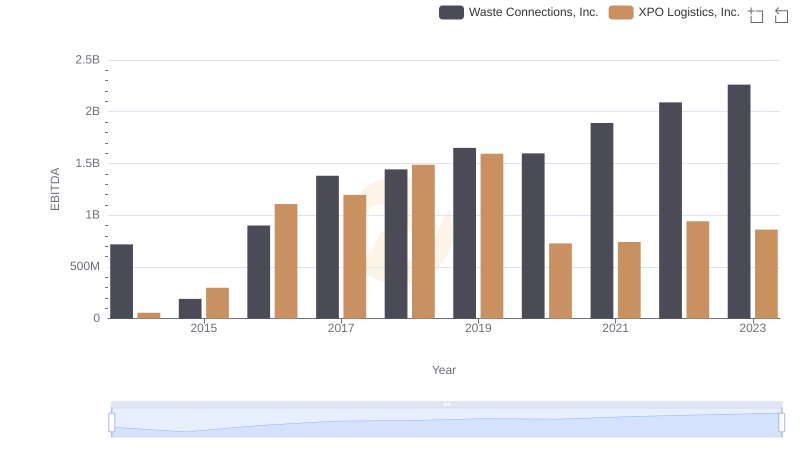
Comprehensive EBITDA Comparison: Waste Connections, Inc. vs XPO Logistics, Inc.