| __timestamp | Textron Inc. | Waste Connections, Inc. |
|---|---|---|
| Wednesday, January 1, 2014 | 1575000000 | 717805000 |
| Thursday, January 1, 2015 | 1601000000 | 191002871 |
| Friday, January 1, 2016 | 1484000000 | 900371894 |
| Sunday, January 1, 2017 | 1367000000 | 1380632000 |
| Monday, January 1, 2018 | 1974000000 | 1442229014 |
| Tuesday, January 1, 2019 | 1518000000 | 1650754605 |
| Wednesday, January 1, 2020 | 827000000 | 1597555000 |
| Friday, January 1, 2021 | 1391000000 | 1891001000 |
| Saturday, January 1, 2022 | 1515000000 | 2090554149 |
| Sunday, January 1, 2023 | 1556000000 | 2261354000 |
| Monday, January 1, 2024 | 1422000000 | 2389779000 |
Data in motion
In the ever-evolving landscape of corporate finance, EBITDA serves as a crucial indicator of a company's operational efficiency. Over the past decade, Waste Connections, Inc. and Textron Inc. have demonstrated intriguing trends in their EBITDA performance. From 2014 to 2023, Waste Connections, Inc. has shown a remarkable growth trajectory, with EBITDA increasing by approximately 215%, peaking in 2023. In contrast, Textron Inc. experienced a more volatile journey, with a notable dip in 2020, reflecting broader economic challenges. However, by 2023, Textron Inc.'s EBITDA rebounded to nearly 99% of its 2014 value. This analysis highlights the resilience and strategic adaptability of these companies in navigating economic fluctuations. Notably, data for Waste Connections, Inc. in 2024 is missing, leaving room for speculation on its future performance.
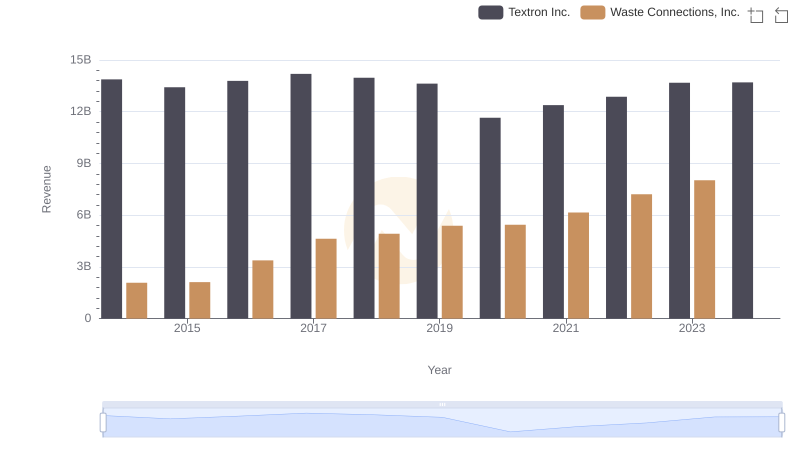
Waste Connections, Inc. and Textron Inc.: A Comprehensive Revenue Analysis
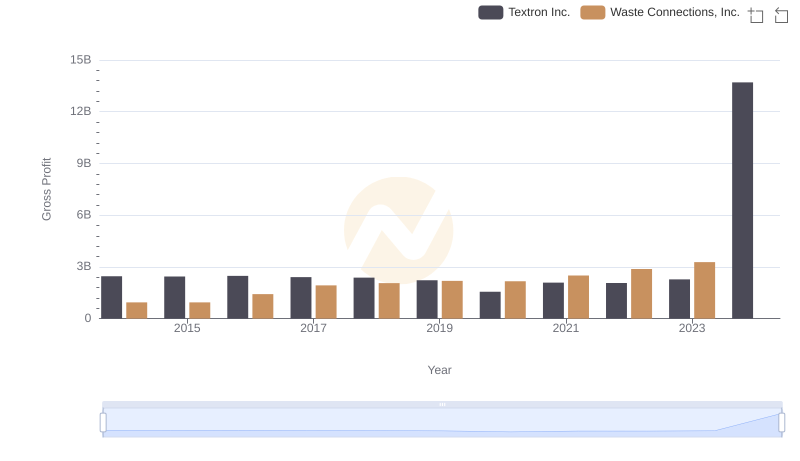
Gross Profit Comparison: Waste Connections, Inc. and Textron Inc. Trends
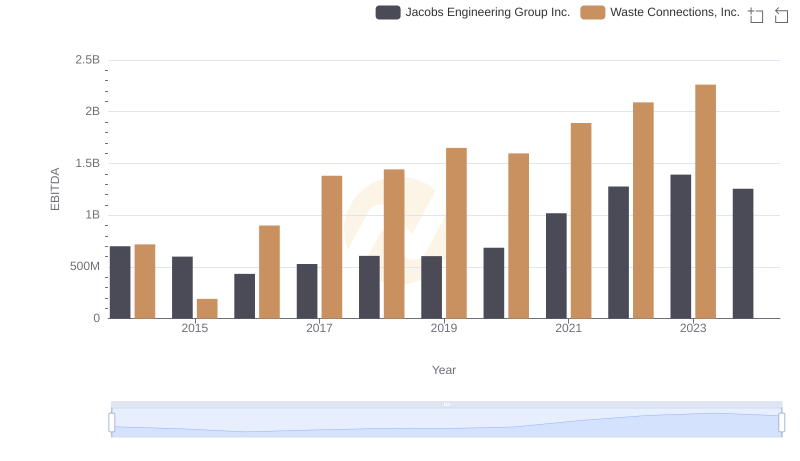
EBITDA Performance Review: Waste Connections, Inc. vs Jacobs Engineering Group Inc.
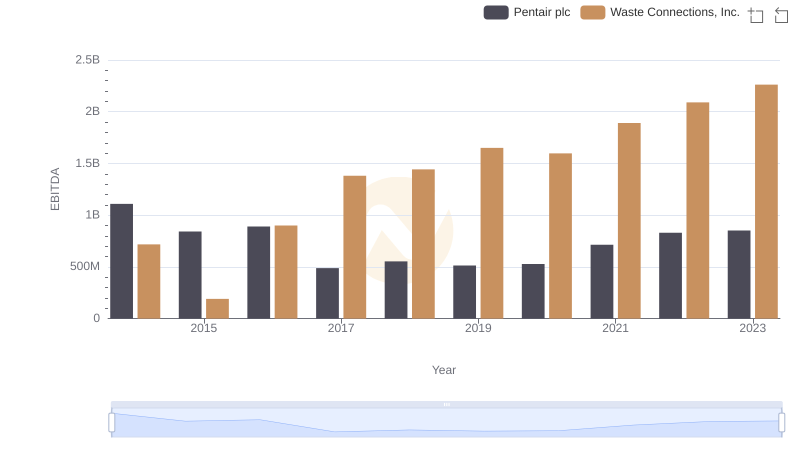
Comprehensive EBITDA Comparison: Waste Connections, Inc. vs Pentair plc
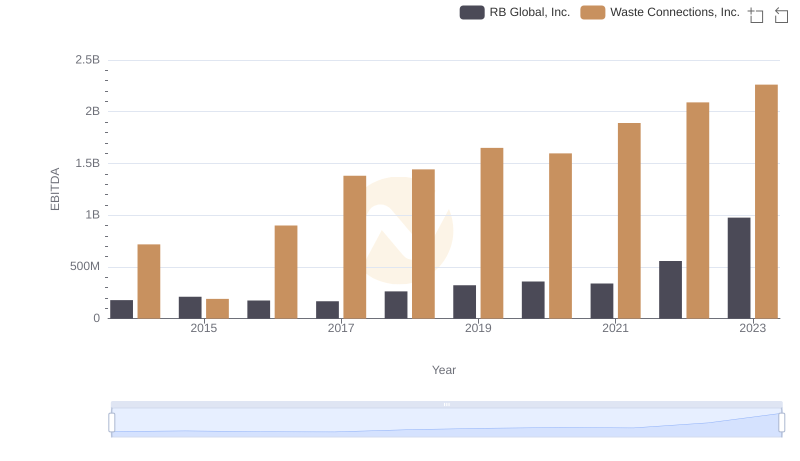
Professional EBITDA Benchmarking: Waste Connections, Inc. vs RB Global, Inc.
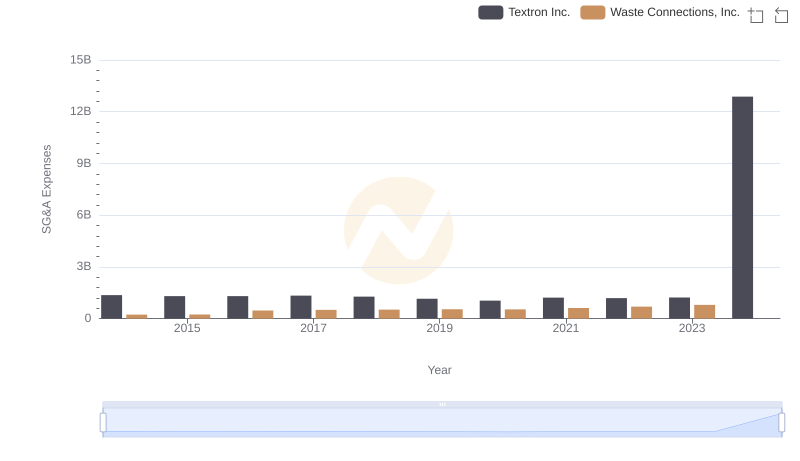
Breaking Down SG&A Expenses: Waste Connections, Inc. vs Textron Inc.
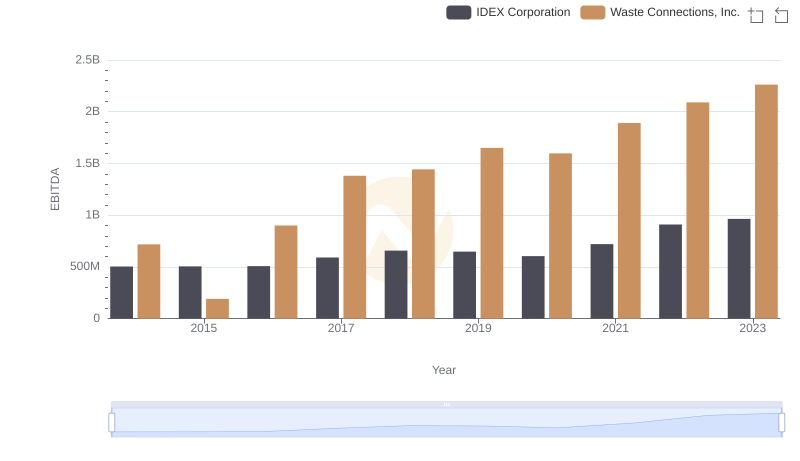
Waste Connections, Inc. vs IDEX Corporation: In-Depth EBITDA Performance Comparison
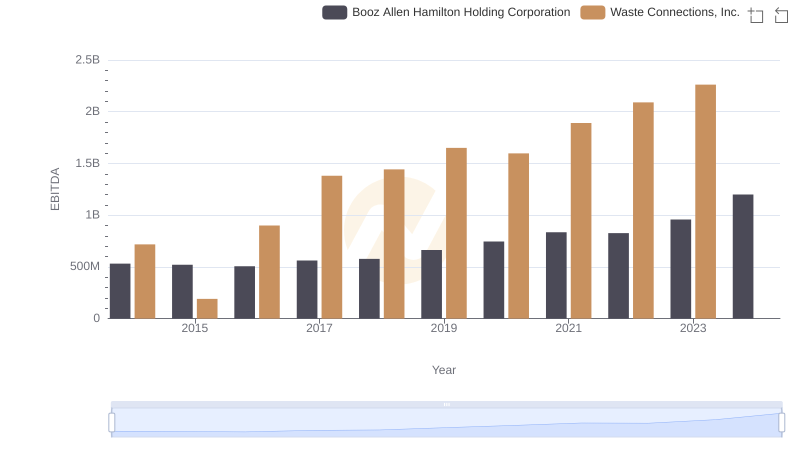
EBITDA Analysis: Evaluating Waste Connections, Inc. Against Booz Allen Hamilton Holding Corporation
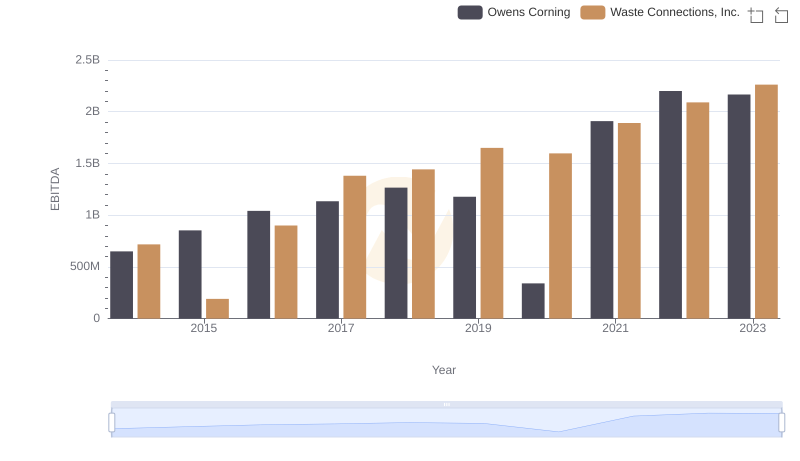
EBITDA Metrics Evaluated: Waste Connections, Inc. vs Owens Corning
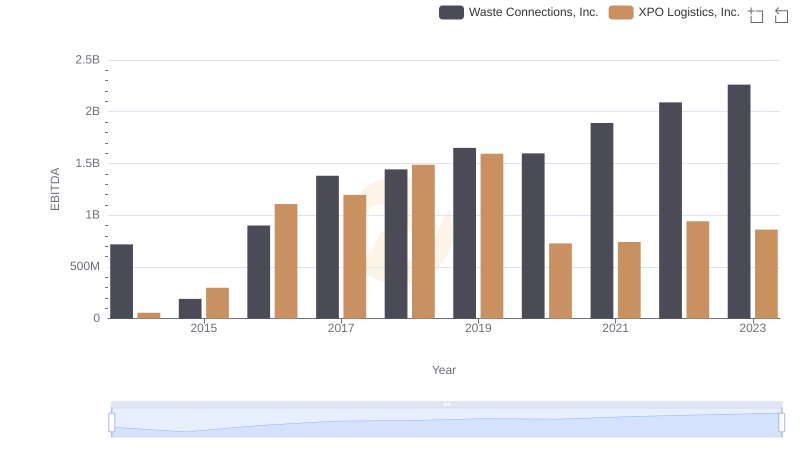
Comprehensive EBITDA Comparison: Waste Connections, Inc. vs XPO Logistics, Inc.