| __timestamp | IDEX Corporation | Waste Connections, Inc. |
|---|---|---|
| Wednesday, January 1, 2014 | 949315000 | 940778000 |
| Thursday, January 1, 2015 | 904315000 | 939878000 |
| Friday, January 1, 2016 | 930767000 | 1418151000 |
| Sunday, January 1, 2017 | 1026678000 | 1925713000 |
| Monday, January 1, 2018 | 1117895000 | 2057237000 |
| Tuesday, January 1, 2019 | 1125034000 | 2189922000 |
| Wednesday, January 1, 2020 | 1027424000 | 2169182000 |
| Friday, January 1, 2021 | 1224500000 | 2497287000 |
| Saturday, January 1, 2022 | 1426900000 | 2875847000 |
| Sunday, January 1, 2023 | 1448500000 | 3277438000 |
| Monday, January 1, 2024 | 1454800000 | 3727885000 |
Infusing magic into the data realm
In the ever-evolving landscape of industrial services, Waste Connections, Inc. and IDEX Corporation have emerged as key players. Over the past decade, from 2014 to 2023, these companies have demonstrated remarkable growth in gross profit, reflecting their strategic prowess and market adaptability.
Waste Connections, Inc. has seen its gross profit soar by approximately 248%, from just under $940 million in 2014 to over $3.27 billion in 2023. This impressive growth underscores the company's ability to capitalize on market opportunities and expand its footprint.
Meanwhile, IDEX Corporation has also experienced a robust increase, with its gross profit rising by about 52% over the same period. Starting at around $949 million in 2014, it reached nearly $1.45 billion by 2023, showcasing its resilience and innovation in the industrial sector.
These trends highlight the dynamic nature of the industry and the strategic initiatives that have propelled these companies forward.
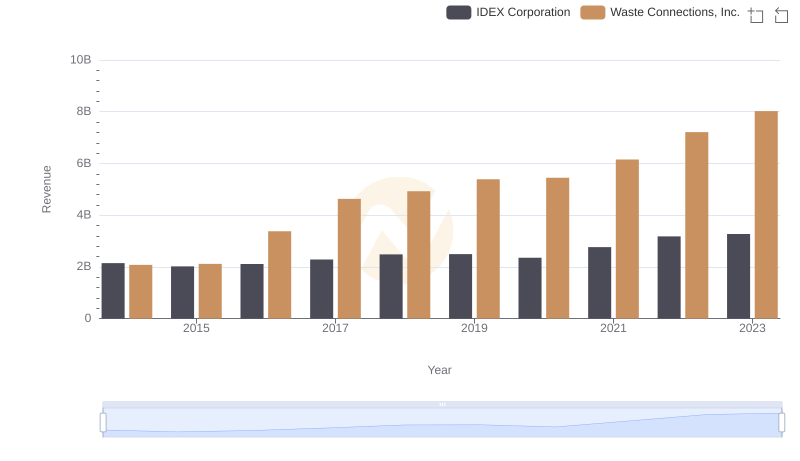
Revenue Insights: Waste Connections, Inc. and IDEX Corporation Performance Compared
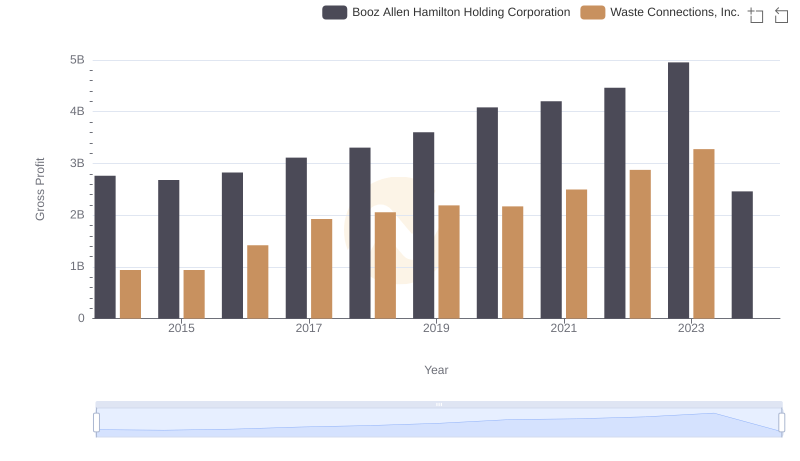
Gross Profit Comparison: Waste Connections, Inc. and Booz Allen Hamilton Holding Corporation Trends
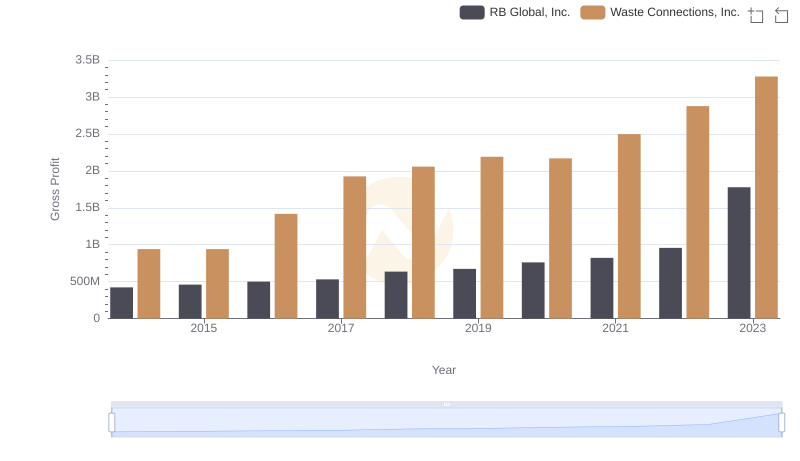
Waste Connections, Inc. and RB Global, Inc.: A Detailed Gross Profit Analysis
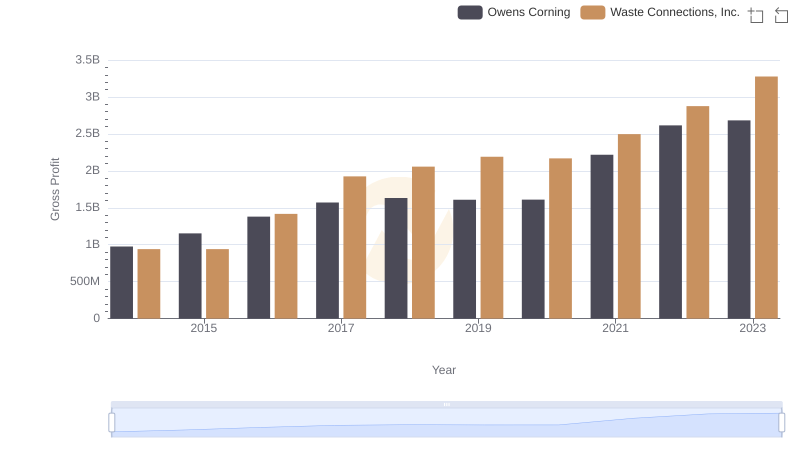
Who Generates Higher Gross Profit? Waste Connections, Inc. or Owens Corning
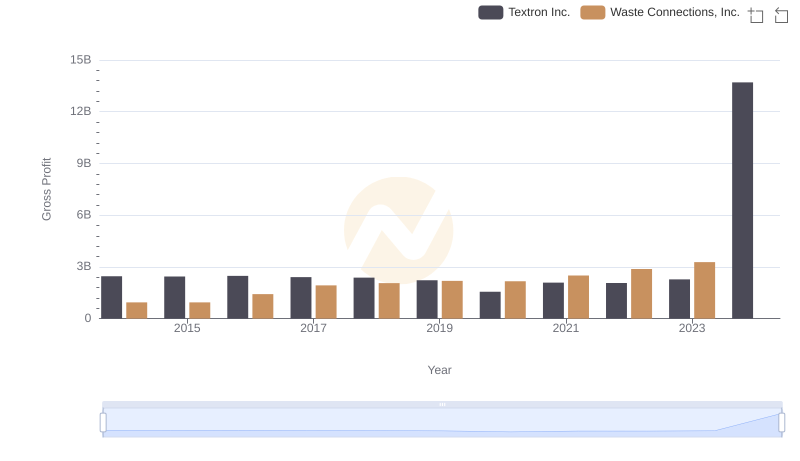
Gross Profit Comparison: Waste Connections, Inc. and Textron Inc. Trends
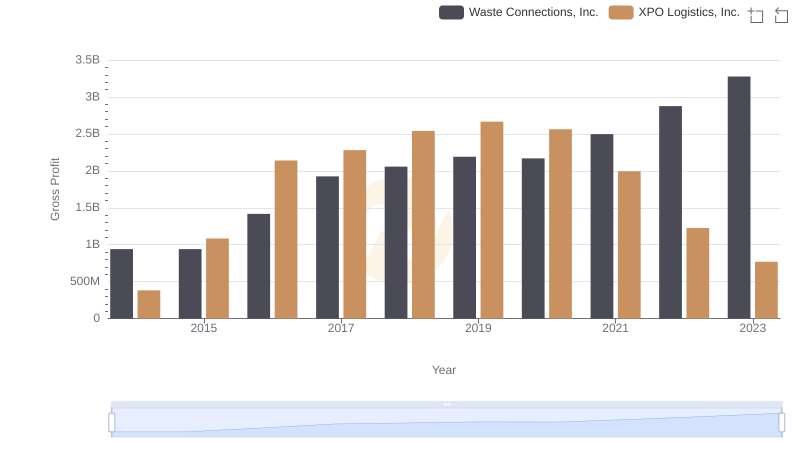
Who Generates Higher Gross Profit? Waste Connections, Inc. or XPO Logistics, Inc.
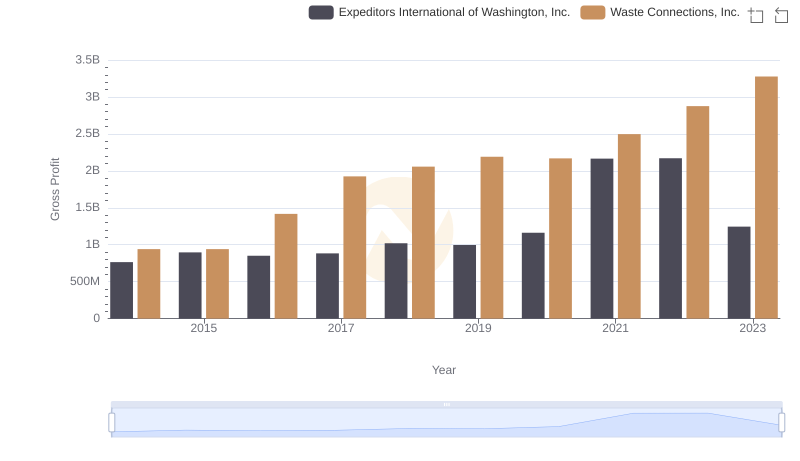
Gross Profit Trends Compared: Waste Connections, Inc. vs Expeditors International of Washington, Inc.

Waste Connections, Inc. and IDEX Corporation: SG&A Spending Patterns Compared
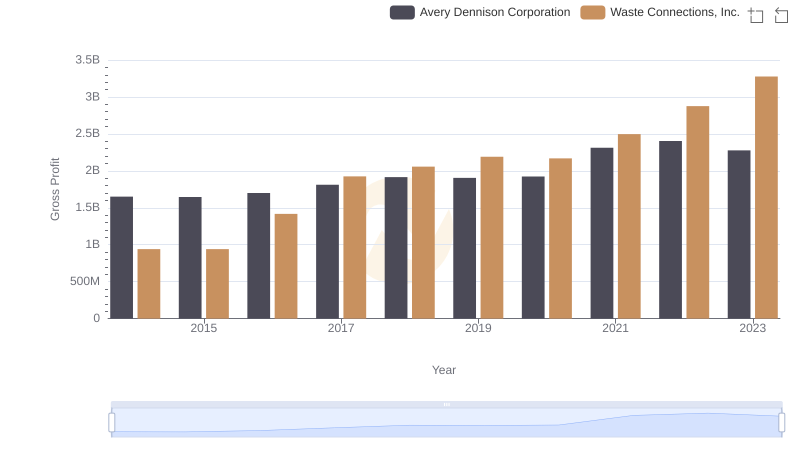
Gross Profit Comparison: Waste Connections, Inc. and Avery Dennison Corporation Trends
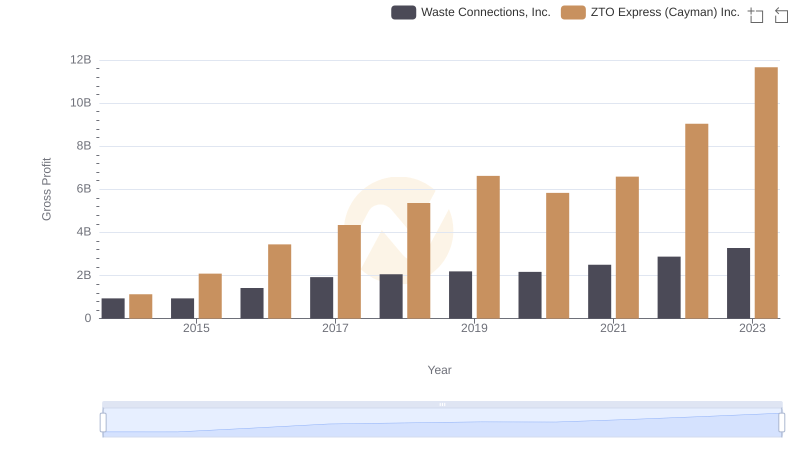
Waste Connections, Inc. vs ZTO Express (Cayman) Inc.: A Gross Profit Performance Breakdown
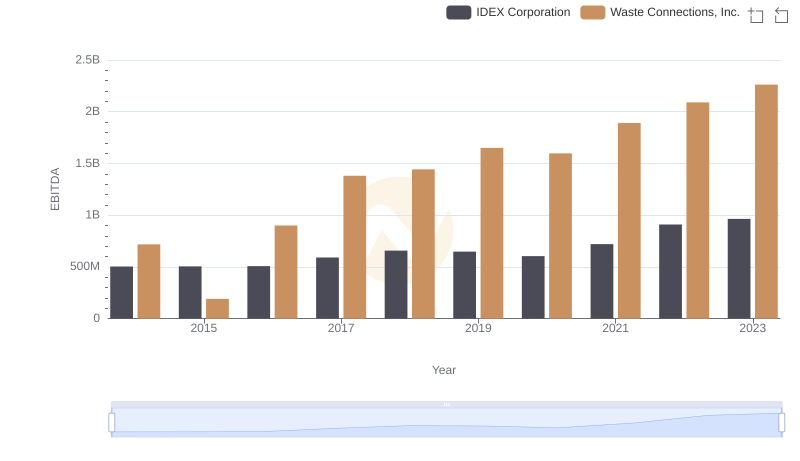
Waste Connections, Inc. vs IDEX Corporation: In-Depth EBITDA Performance Comparison