| __timestamp | IDEX Corporation | Waste Connections, Inc. |
|---|---|---|
| Wednesday, January 1, 2014 | 2147767000 | 2079166000 |
| Thursday, January 1, 2015 | 2020668000 | 2117287000 |
| Friday, January 1, 2016 | 2113043000 | 3375863000 |
| Sunday, January 1, 2017 | 2287312000 | 4630488000 |
| Monday, January 1, 2018 | 2483666000 | 4922941000 |
| Tuesday, January 1, 2019 | 2494573000 | 5388679000 |
| Wednesday, January 1, 2020 | 2351646000 | 5445990000 |
| Friday, January 1, 2021 | 2764800000 | 6151361000 |
| Saturday, January 1, 2022 | 3181900000 | 7211859000 |
| Sunday, January 1, 2023 | 3273900000 | 8021951000 |
| Monday, January 1, 2024 | 3268800000 | 8919591000 |
Cracking the code
In the competitive landscape of industrial services, Waste Connections, Inc. and IDEX Corporation have demonstrated remarkable revenue trajectories over the past decade. Since 2014, Waste Connections, Inc. has seen its revenue soar by approximately 286%, reaching a peak in 2023. This growth underscores its strategic expansions and acquisitions in the waste management sector. Meanwhile, IDEX Corporation, a leader in fluid and metering technologies, has experienced a steady revenue increase of about 52% over the same period.
The data reveals that Waste Connections, Inc. consistently outpaced IDEX Corporation in revenue growth, particularly from 2016 onwards. By 2023, Waste Connections, Inc.'s revenue was nearly double that of IDEX Corporation, highlighting its dominant market position. This comparison not only reflects the companies' operational efficiencies but also their ability to adapt to market demands and economic shifts.
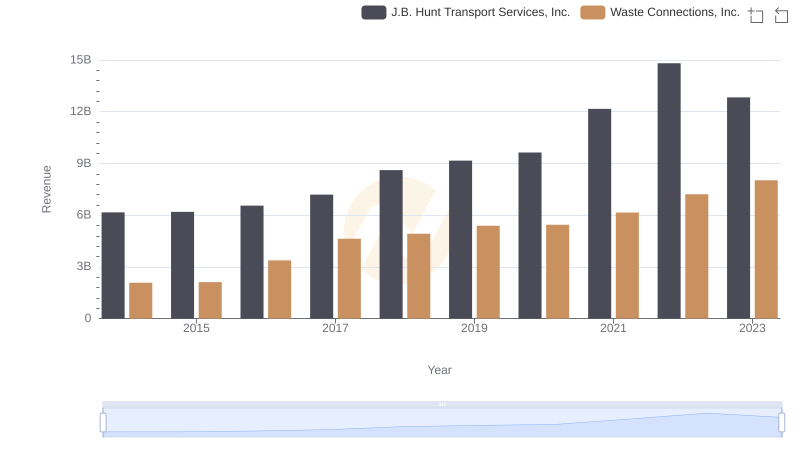
Waste Connections, Inc. or J.B. Hunt Transport Services, Inc.: Who Leads in Yearly Revenue?
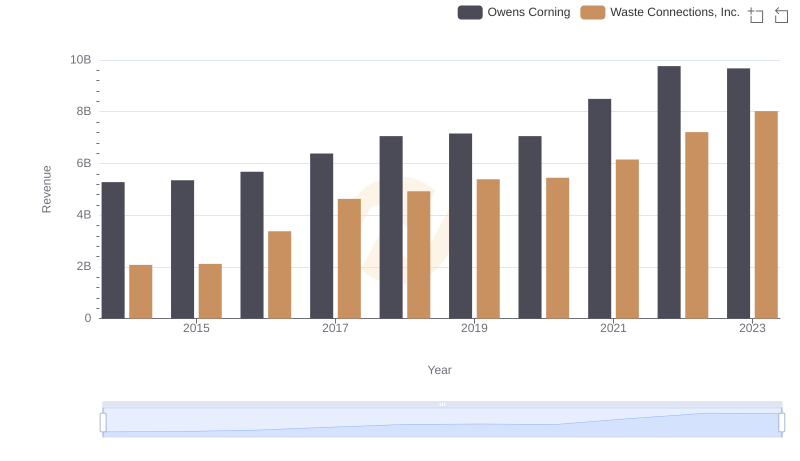
Comparing Revenue Performance: Waste Connections, Inc. or Owens Corning?
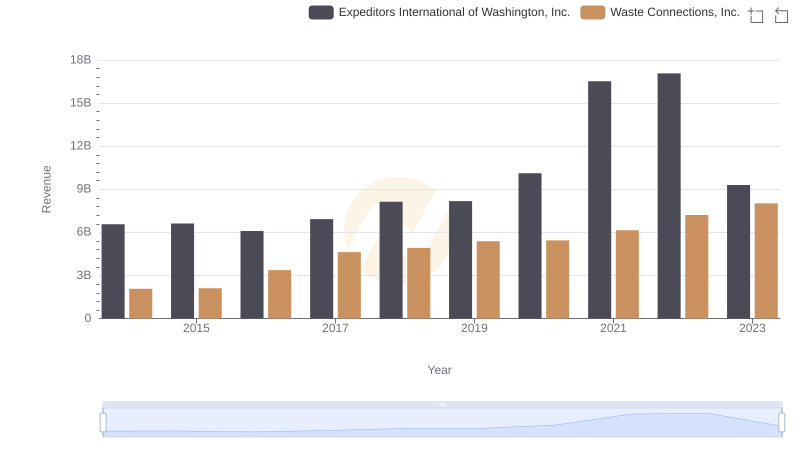
Waste Connections, Inc. or Expeditors International of Washington, Inc.: Who Leads in Yearly Revenue?
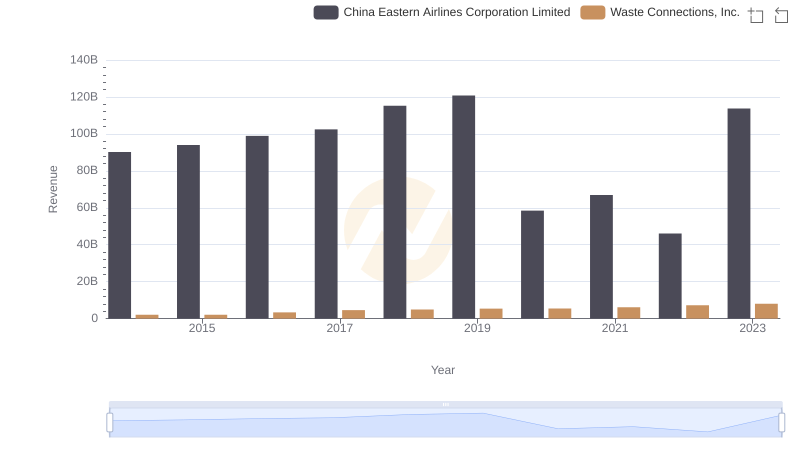
Revenue Insights: Waste Connections, Inc. and China Eastern Airlines Corporation Limited Performance Compared
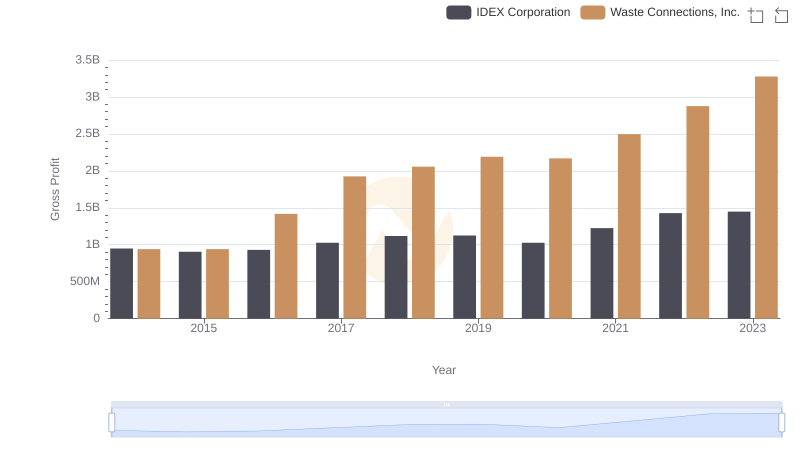
Gross Profit Comparison: Waste Connections, Inc. and IDEX Corporation Trends

Waste Connections, Inc. and IDEX Corporation: SG&A Spending Patterns Compared
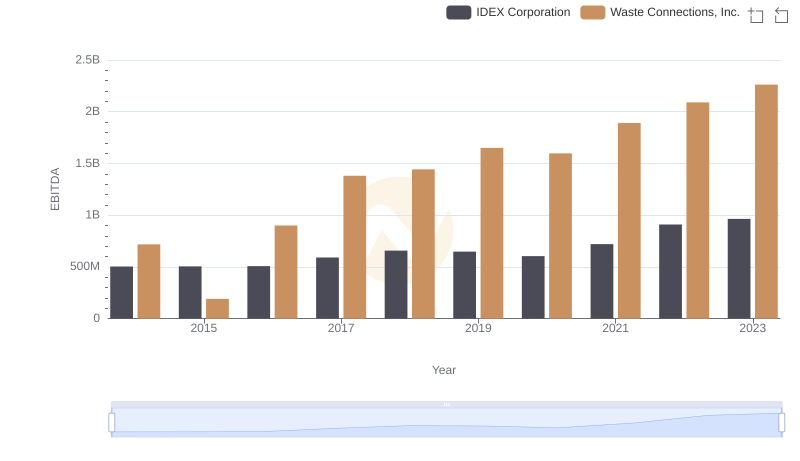
Waste Connections, Inc. vs IDEX Corporation: In-Depth EBITDA Performance Comparison