| __timestamp | Clean Harbors, Inc. | Waste Connections, Inc. |
|---|---|---|
| Wednesday, January 1, 2014 | 437921000 | 229474000 |
| Thursday, January 1, 2015 | 414164000 | 237484000 |
| Friday, January 1, 2016 | 422015000 | 474263000 |
| Sunday, January 1, 2017 | 456648000 | 509638000 |
| Monday, January 1, 2018 | 503747000 | 524388000 |
| Tuesday, January 1, 2019 | 484054000 | 546278000 |
| Wednesday, January 1, 2020 | 451044000 | 537632000 |
| Friday, January 1, 2021 | 537962000 | 612337000 |
| Saturday, January 1, 2022 | 627391000 | 696467000 |
| Sunday, January 1, 2023 | 671161000 | 799119000 |
| Monday, January 1, 2024 | 739629000 | 883445000 |
In pursuit of knowledge
In the competitive landscape of waste management, understanding the financial dynamics of industry leaders is crucial. Over the past decade, Waste Connections, Inc. and Clean Harbors, Inc. have shown distinct trends in their Selling, General, and Administrative (SG&A) expenses. From 2014 to 2023, Waste Connections, Inc. has seen a remarkable increase of approximately 248% in SG&A expenses, peaking in 2023. In contrast, Clean Harbors, Inc. experienced a more modest growth of around 62% over the same period. Notably, Waste Connections, Inc. surpassed Clean Harbors, Inc. in SG&A expenses starting in 2016, maintaining a lead that widened to nearly 19% by 2023. This financial trajectory highlights Waste Connections, Inc.'s aggressive expansion strategy, while Clean Harbors, Inc. appears to focus on steady, controlled growth. These insights provide a window into the strategic priorities of these industry giants.
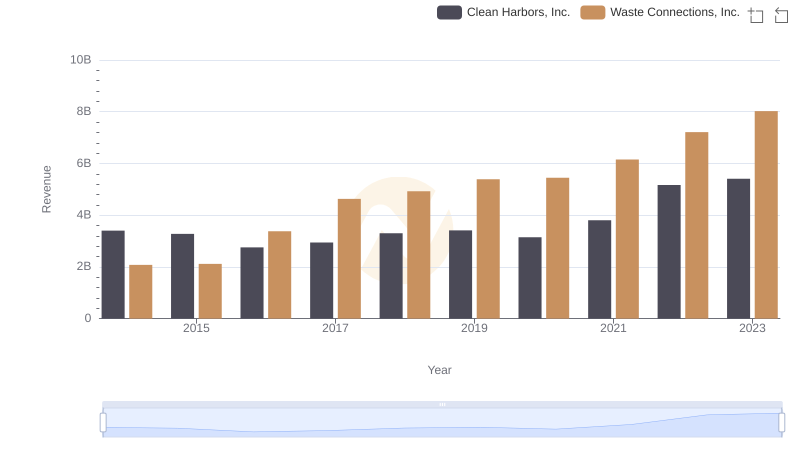
Waste Connections, Inc. or Clean Harbors, Inc.: Who Leads in Yearly Revenue?
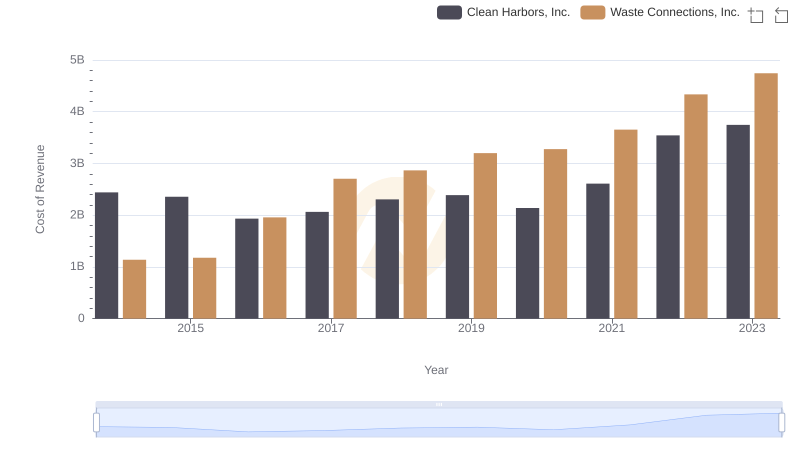
Waste Connections, Inc. vs Clean Harbors, Inc.: Efficiency in Cost of Revenue Explored
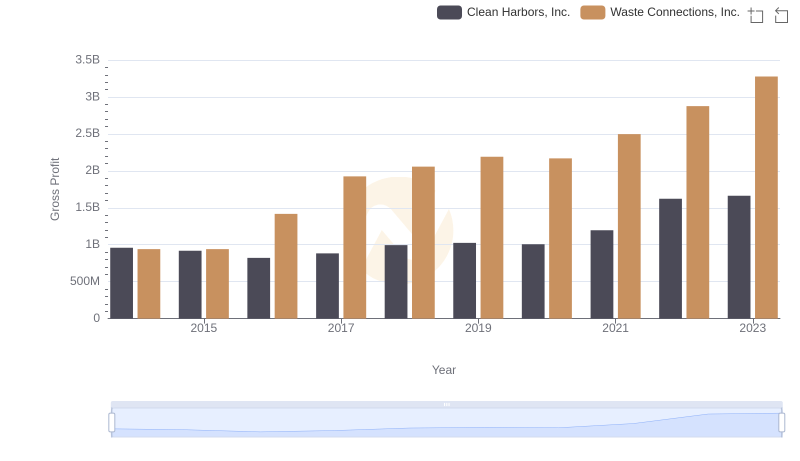
Waste Connections, Inc. and Clean Harbors, Inc.: A Detailed Gross Profit Analysis
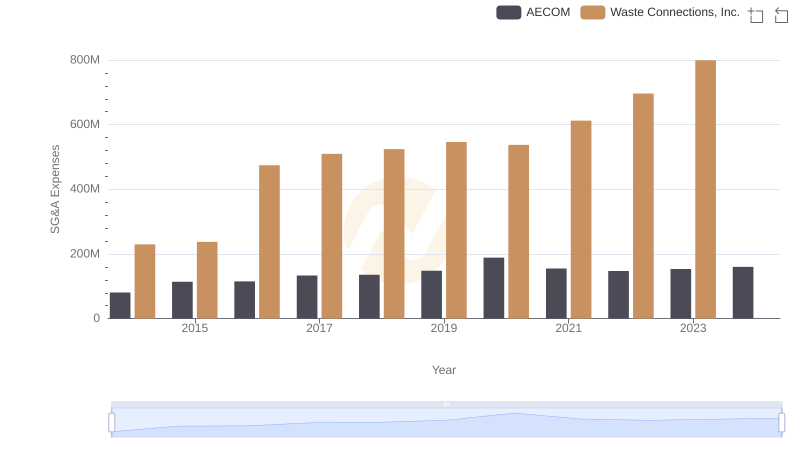
Comparing SG&A Expenses: Waste Connections, Inc. vs AECOM Trends and Insights
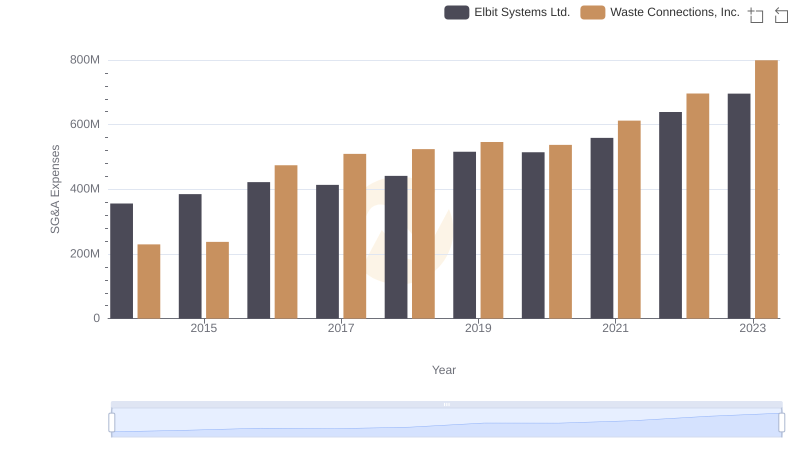
Waste Connections, Inc. and Elbit Systems Ltd.: SG&A Spending Patterns Compared
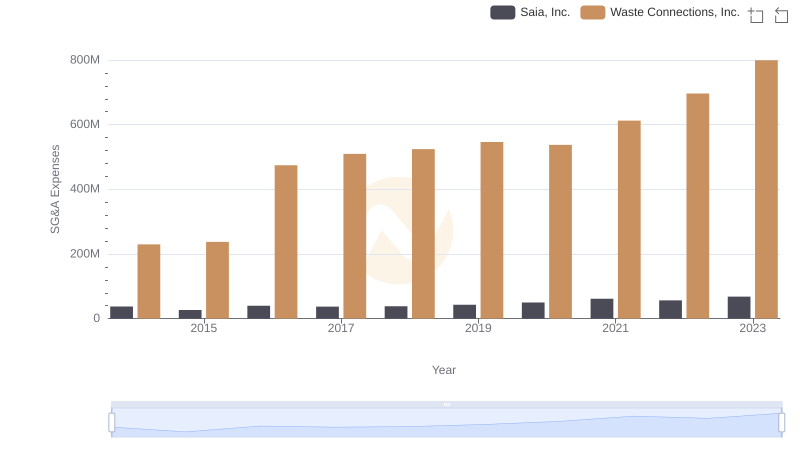
SG&A Efficiency Analysis: Comparing Waste Connections, Inc. and Saia, Inc.
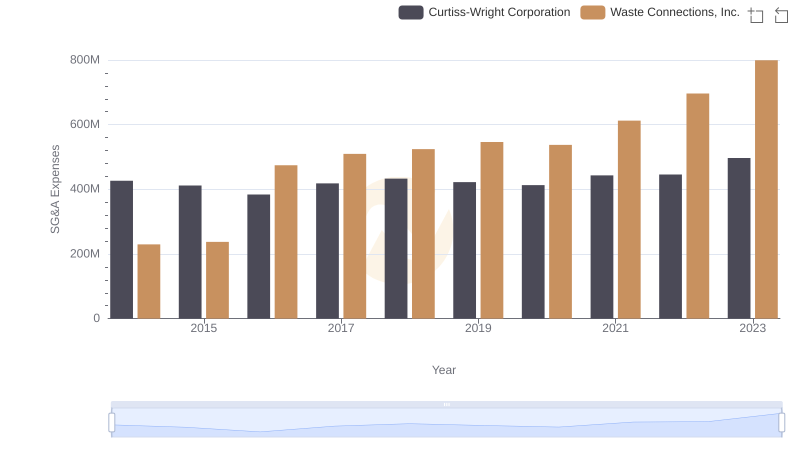
Waste Connections, Inc. vs Curtiss-Wright Corporation: SG&A Expense Trends