| __timestamp | Clean Harbors, Inc. | Waste Connections, Inc. |
|---|---|---|
| Wednesday, January 1, 2014 | 959840000 | 940778000 |
| Thursday, January 1, 2015 | 918331000 | 939878000 |
| Friday, January 1, 2016 | 822369000 | 1418151000 |
| Sunday, January 1, 2017 | 882305000 | 1925713000 |
| Monday, January 1, 2018 | 994752000 | 2057237000 |
| Tuesday, January 1, 2019 | 1024371000 | 2189922000 |
| Wednesday, January 1, 2020 | 1006346000 | 2169182000 |
| Friday, January 1, 2021 | 1195729000 | 2497287000 |
| Saturday, January 1, 2022 | 1622675000 | 2875847000 |
| Sunday, January 1, 2023 | 1663028000 | 3277438000 |
| Monday, January 1, 2024 | 1824239000 | 3727885000 |
Unveiling the hidden dimensions of data
In the ever-evolving landscape of waste management, Waste Connections, Inc. and Clean Harbors, Inc. have emerged as industry leaders. Over the past decade, these companies have demonstrated remarkable growth in gross profit, reflecting their strategic prowess and operational efficiency.
From 2014 to 2023, Waste Connections, Inc. saw its gross profit soar by approximately 248%, reaching a peak in 2023. This impressive growth underscores the company's ability to adapt and thrive in a competitive market. Meanwhile, Clean Harbors, Inc. experienced a robust 73% increase in gross profit over the same period, highlighting its resilience and commitment to sustainable practices.
The data reveals a compelling narrative of two companies navigating the complexities of the waste management sector, each carving out a distinct path to profitability. As we look to the future, these trends offer valuable insights into the strategies that drive success in this critical industry.
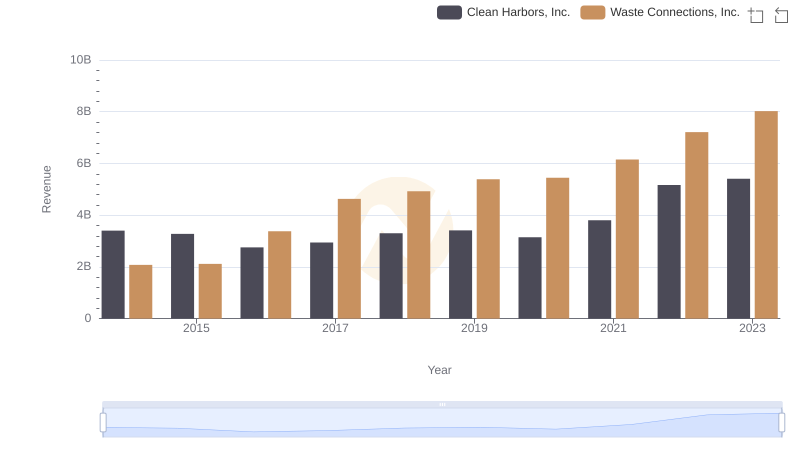
Waste Connections, Inc. or Clean Harbors, Inc.: Who Leads in Yearly Revenue?
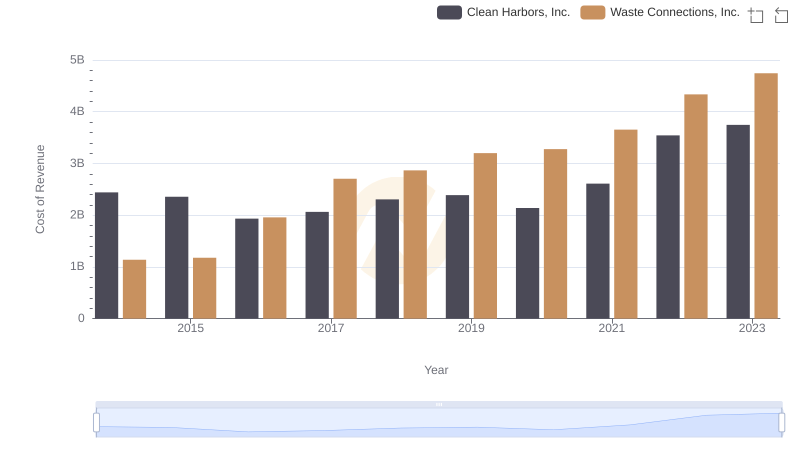
Waste Connections, Inc. vs Clean Harbors, Inc.: Efficiency in Cost of Revenue Explored

Waste Connections, Inc. and AECOM: A Detailed Gross Profit Analysis
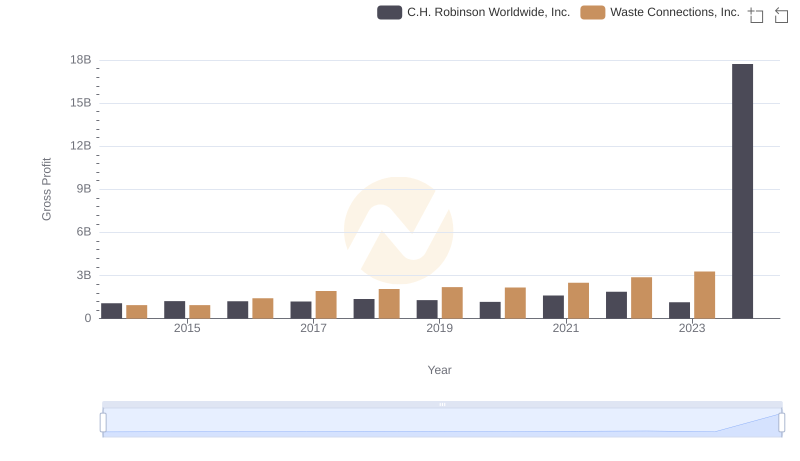
Key Insights on Gross Profit: Waste Connections, Inc. vs C.H. Robinson Worldwide, Inc.
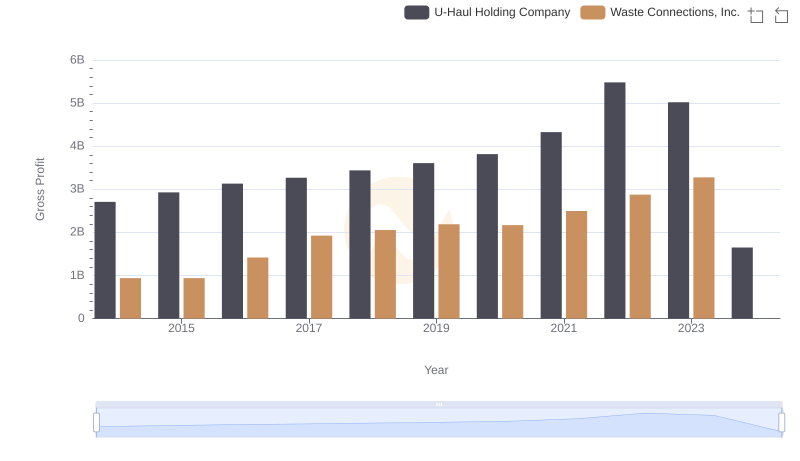
Key Insights on Gross Profit: Waste Connections, Inc. vs U-Haul Holding Company
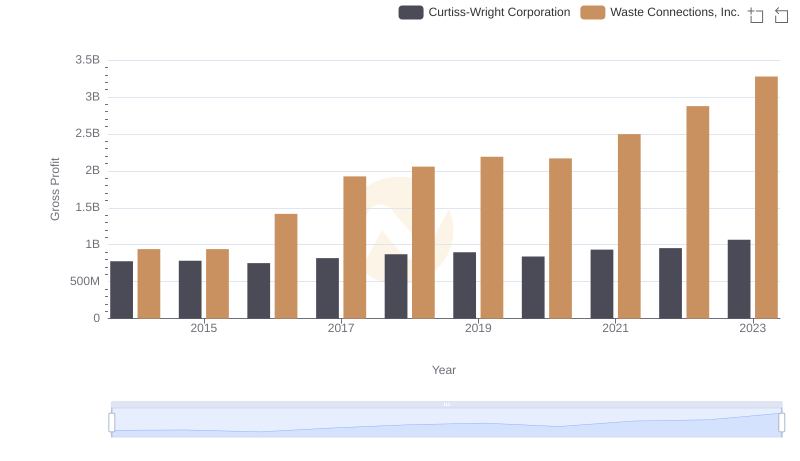
Gross Profit Trends Compared: Waste Connections, Inc. vs Curtiss-Wright Corporation
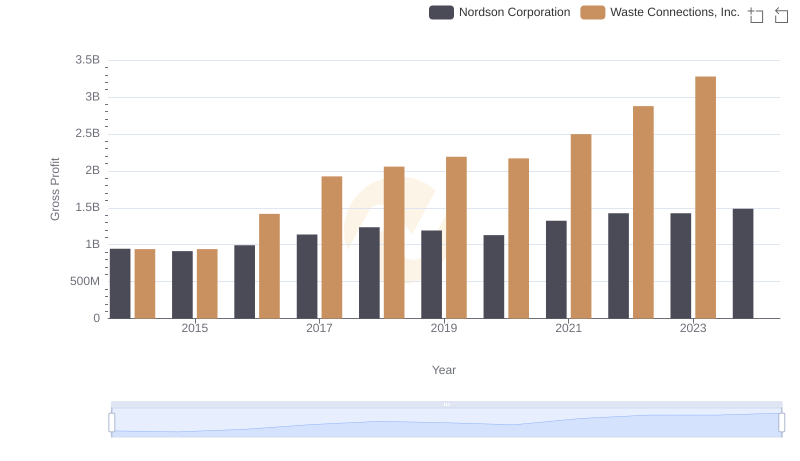
Gross Profit Comparison: Waste Connections, Inc. and Nordson Corporation Trends
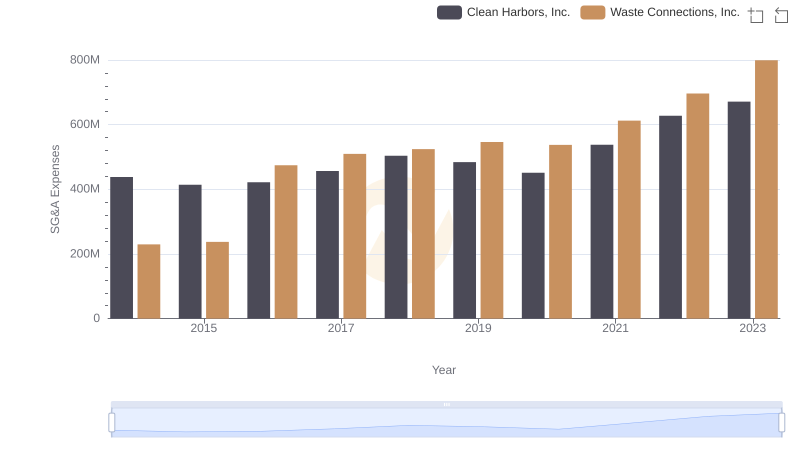
Selling, General, and Administrative Costs: Waste Connections, Inc. vs Clean Harbors, Inc.
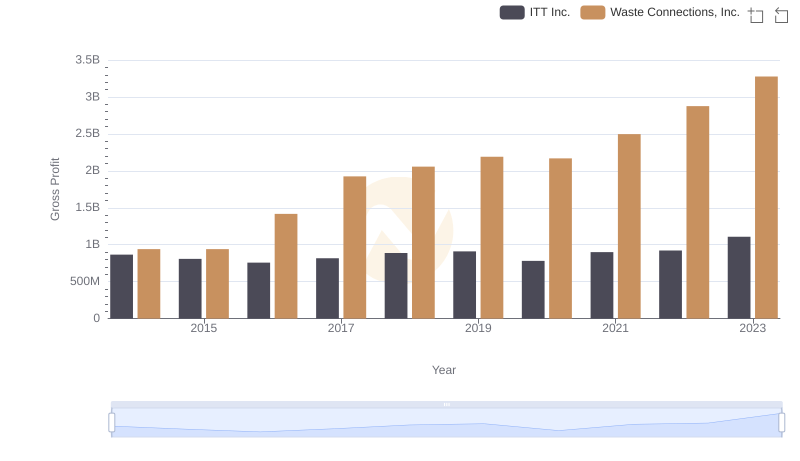
Waste Connections, Inc. vs ITT Inc.: A Gross Profit Performance Breakdown