| __timestamp | L3Harris Technologies, Inc. | United Rentals, Inc. |
|---|---|---|
| Wednesday, January 1, 2014 | 879000000 | 1678000000 |
| Thursday, January 1, 2015 | 1356000000 | 2653000000 |
| Friday, January 1, 2016 | 1350000000 | 2566000000 |
| Sunday, January 1, 2017 | 1356000000 | 2843000000 |
| Monday, January 1, 2018 | 1538000000 | 3628000000 |
| Tuesday, January 1, 2019 | 2980000000 | 4200000000 |
| Wednesday, January 1, 2020 | 2639000000 | 2195000000 |
| Friday, January 1, 2021 | 3518000000 | 2642000000 |
| Saturday, January 1, 2022 | 2499000000 | 5464000000 |
| Sunday, January 1, 2023 | 2932000000 | 6627000000 |
| Monday, January 1, 2024 | 3561000000 | 4516000000 |
Cracking the code
In the ever-evolving landscape of American industry, United Rentals, Inc. and L3Harris Technologies, Inc. stand as titans in their respective fields. Over the past decade, from 2014 to 2023, these companies have demonstrated remarkable financial trajectories, particularly in terms of EBITDA. United Rentals has shown a robust growth, with its EBITDA surging by nearly 295% from 2014 to 2023. In contrast, L3Harris Technologies experienced a more modest increase of approximately 233% over the same period. Notably, United Rentals reached its peak EBITDA in 2023, while L3Harris Technologies achieved its highest in 2021. The data for 2024 is incomplete, highlighting the dynamic nature of financial forecasting. This analysis underscores the resilience and strategic prowess of these industry leaders, offering valuable insights for investors and analysts alike.
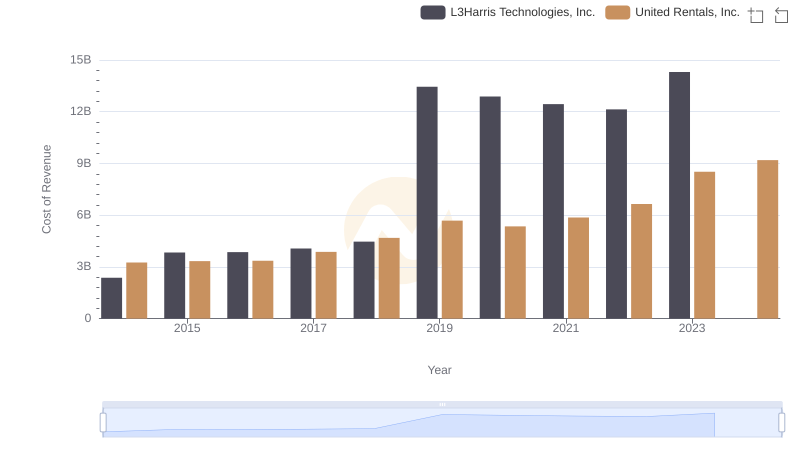
United Rentals, Inc. vs L3Harris Technologies, Inc.: Efficiency in Cost of Revenue Explored
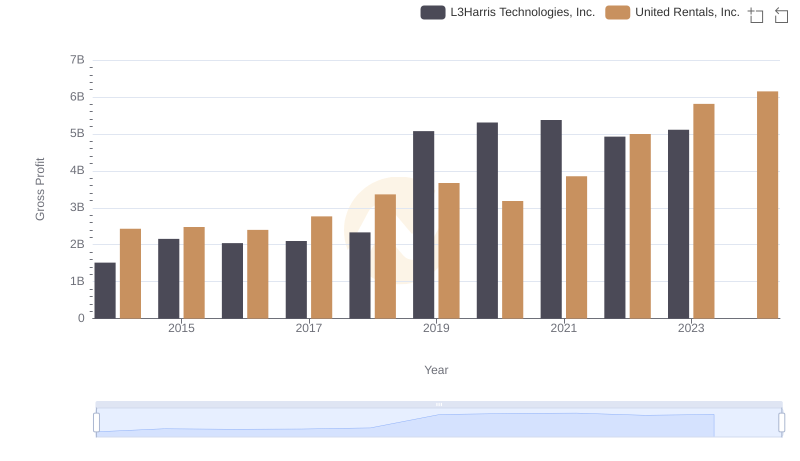
United Rentals, Inc. vs L3Harris Technologies, Inc.: A Gross Profit Performance Breakdown
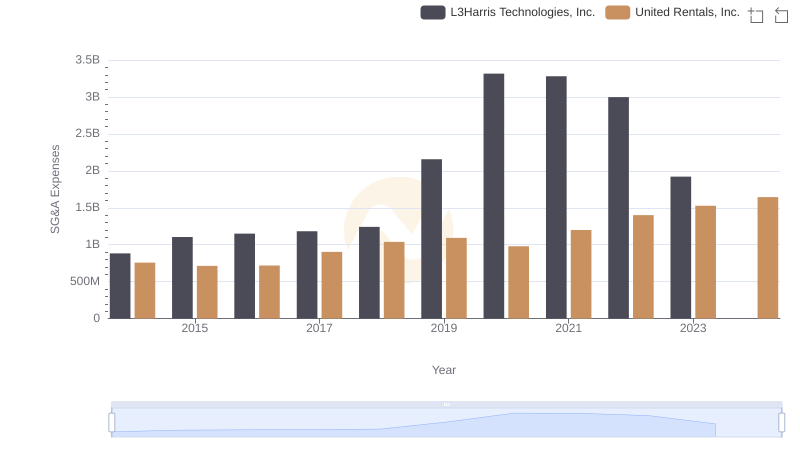
United Rentals, Inc. vs L3Harris Technologies, Inc.: SG&A Expense Trends
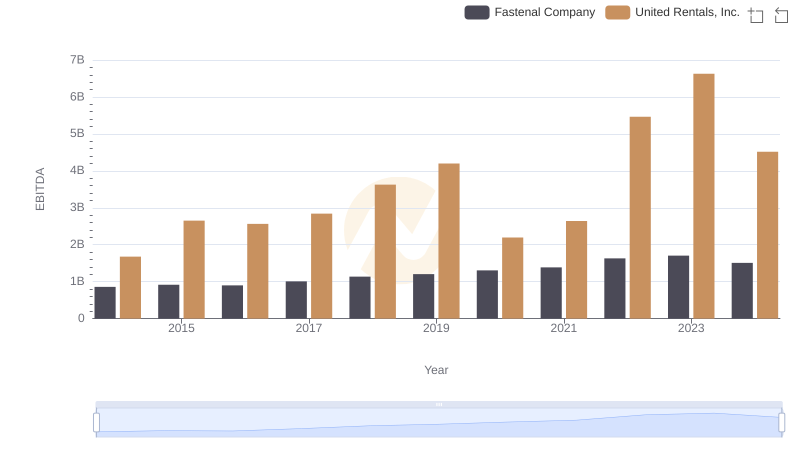
EBITDA Analysis: Evaluating United Rentals, Inc. Against Fastenal Company
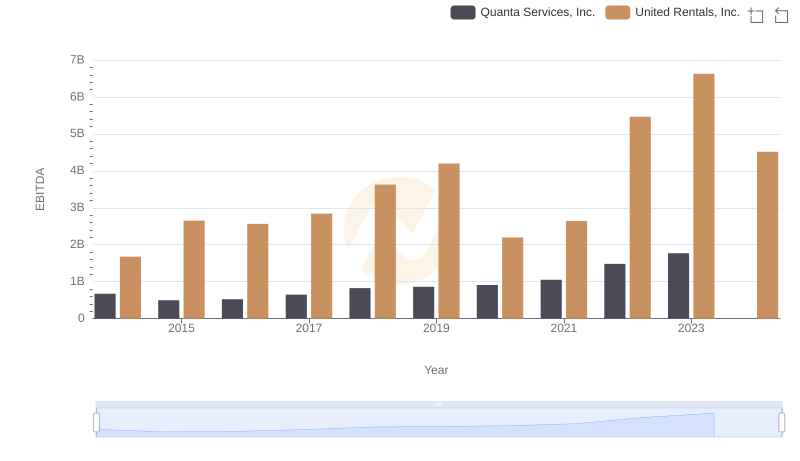
Comprehensive EBITDA Comparison: United Rentals, Inc. vs Quanta Services, Inc.
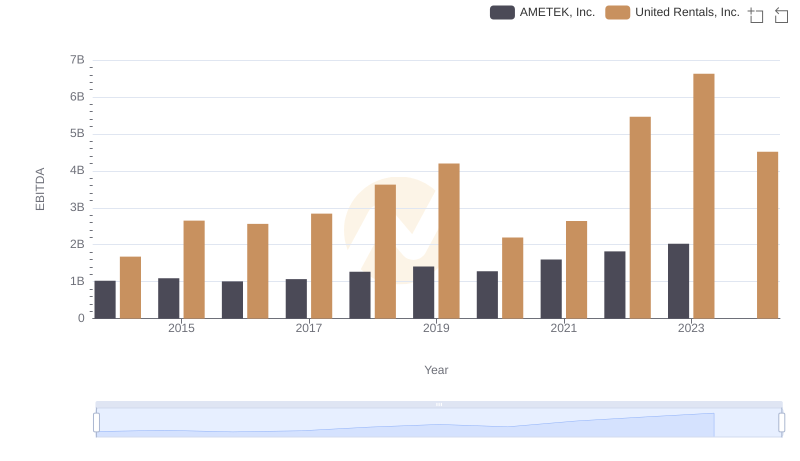
A Side-by-Side Analysis of EBITDA: United Rentals, Inc. and AMETEK, Inc.
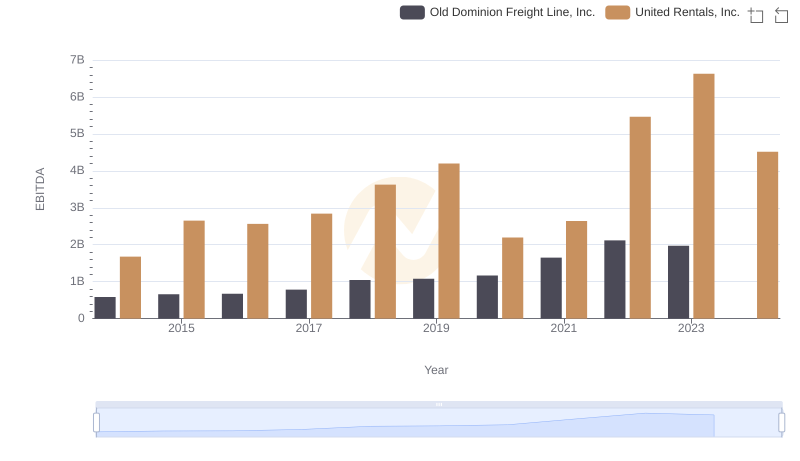
Professional EBITDA Benchmarking: United Rentals, Inc. vs Old Dominion Freight Line, Inc.
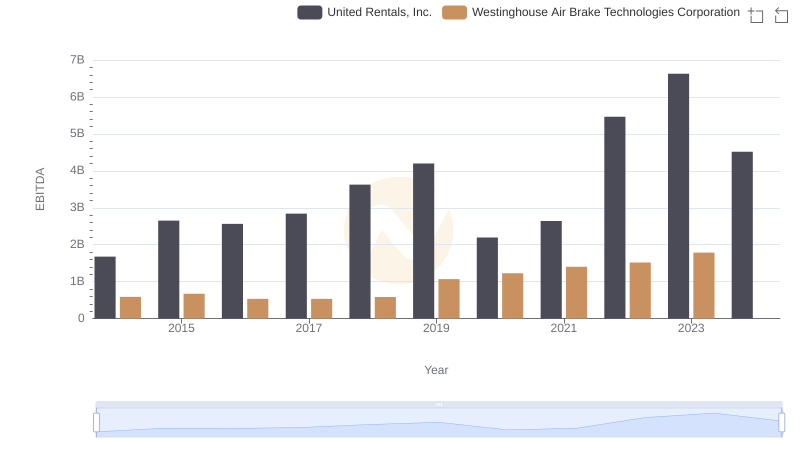
EBITDA Analysis: Evaluating United Rentals, Inc. Against Westinghouse Air Brake Technologies Corporation
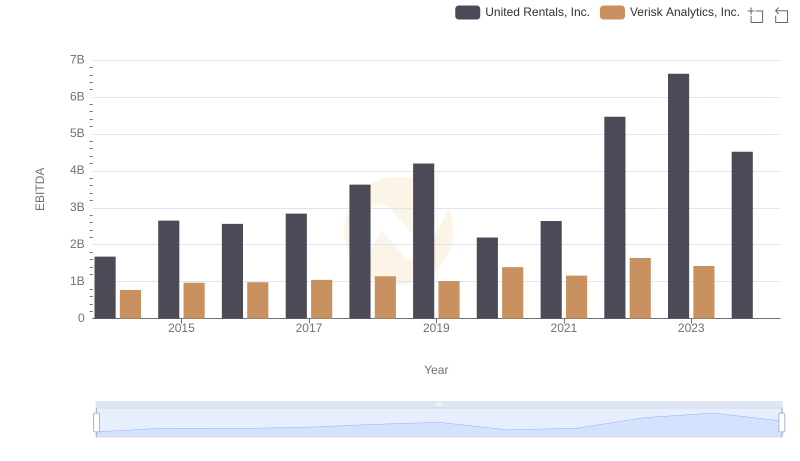
United Rentals, Inc. and Verisk Analytics, Inc.: A Detailed Examination of EBITDA Performance
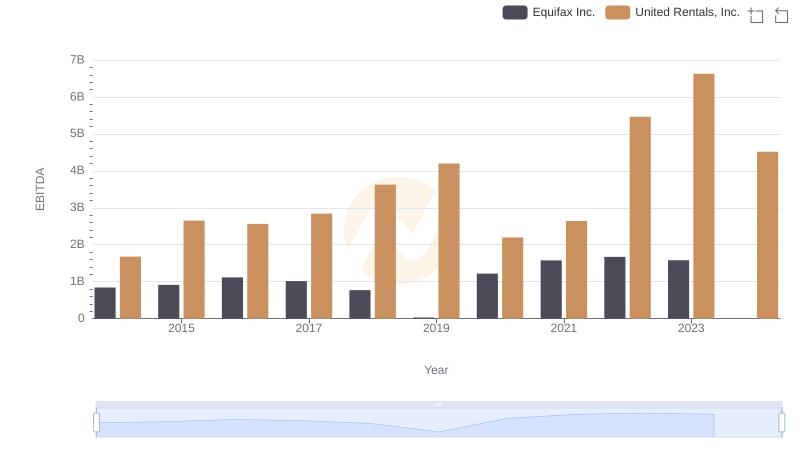
EBITDA Performance Review: United Rentals, Inc. vs Equifax Inc.
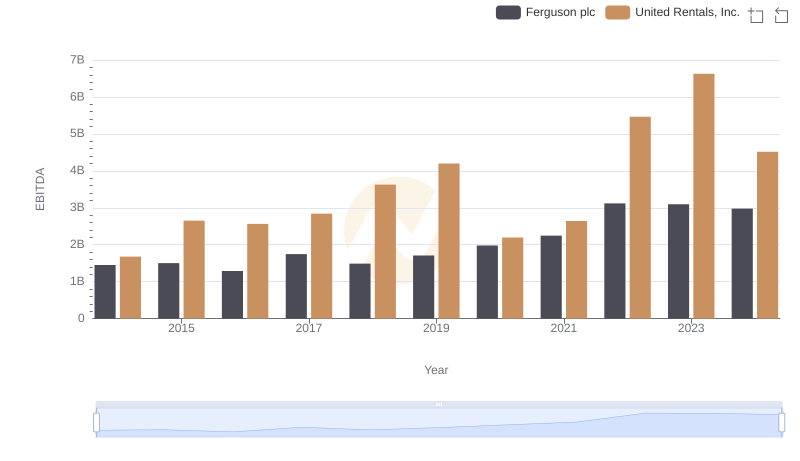
Comprehensive EBITDA Comparison: United Rentals, Inc. vs Ferguson plc