| __timestamp | CNH Industrial N.V. | United Rentals, Inc. |
|---|---|---|
| Wednesday, January 1, 2014 | 2925000000 | 758000000 |
| Thursday, January 1, 2015 | 2317000000 | 714000000 |
| Friday, January 1, 2016 | 2262000000 | 719000000 |
| Sunday, January 1, 2017 | 2330000000 | 903000000 |
| Monday, January 1, 2018 | 2351000000 | 1038000000 |
| Tuesday, January 1, 2019 | 2216000000 | 1092000000 |
| Wednesday, January 1, 2020 | 2155000000 | 979000000 |
| Friday, January 1, 2021 | 2443000000 | 1199000000 |
| Saturday, January 1, 2022 | 1752000000 | 1400000000 |
| Sunday, January 1, 2023 | 1863000000 | 1527000000 |
| Monday, January 1, 2024 | 1645000000 |
Unveiling the hidden dimensions of data
In the competitive landscape of industrial equipment and services, understanding the financial dynamics of key players is crucial. Over the past decade, United Rentals, Inc. and CNH Industrial N.V. have showcased distinct trends in their Selling, General, and Administrative (SG&A) expenses. From 2014 to 2023, CNH Industrial N.V. experienced a notable decline in SG&A expenses, dropping approximately 36% from its peak in 2014. In contrast, United Rentals, Inc. saw a steady increase, with expenses rising by over 100% during the same period. This divergence highlights strategic differences in cost management and operational focus. Notably, 2023 marked a significant year where United Rentals, Inc.'s SG&A expenses surpassed those of CNH Industrial N.V. for the first time. As we look to 2024, the absence of data for CNH Industrial N.V. leaves room for speculation on future financial strategies.
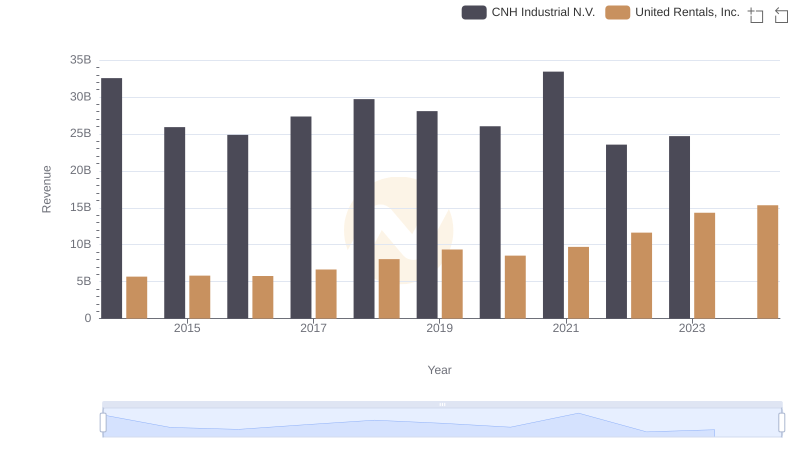
United Rentals, Inc. or CNH Industrial N.V.: Who Leads in Yearly Revenue?
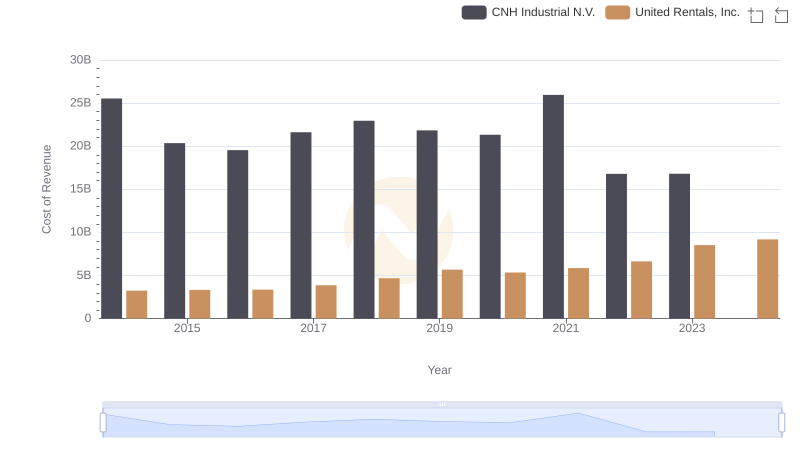
Comparing Cost of Revenue Efficiency: United Rentals, Inc. vs CNH Industrial N.V.
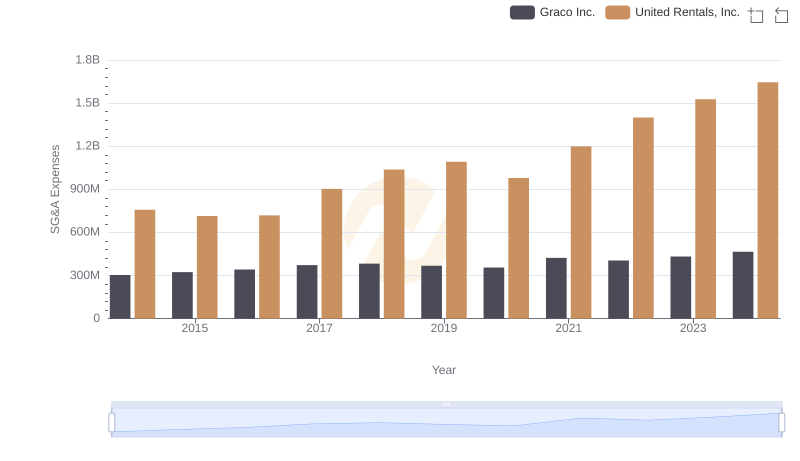
SG&A Efficiency Analysis: Comparing United Rentals, Inc. and Graco Inc.
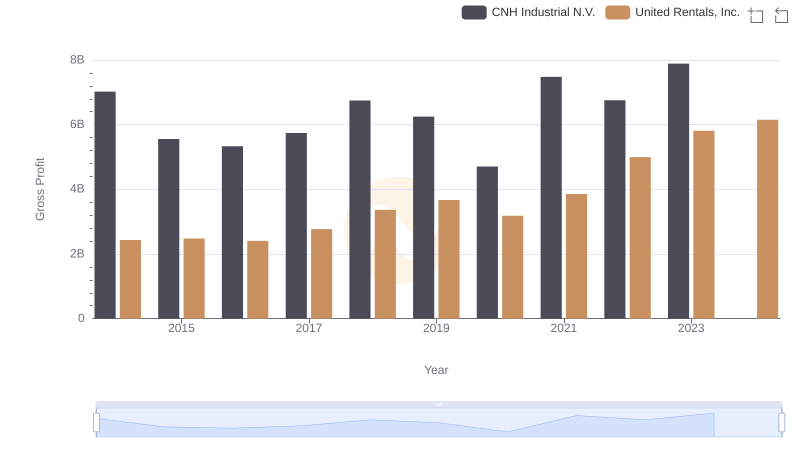
Gross Profit Analysis: Comparing United Rentals, Inc. and CNH Industrial N.V.
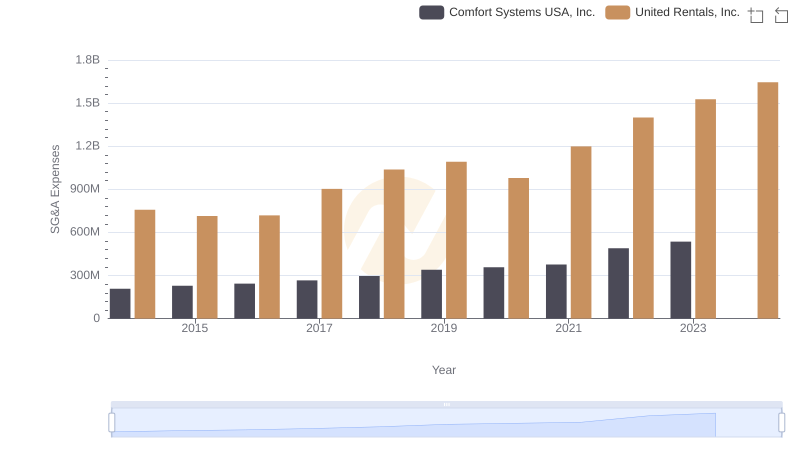
United Rentals, Inc. and Comfort Systems USA, Inc.: SG&A Spending Patterns Compared
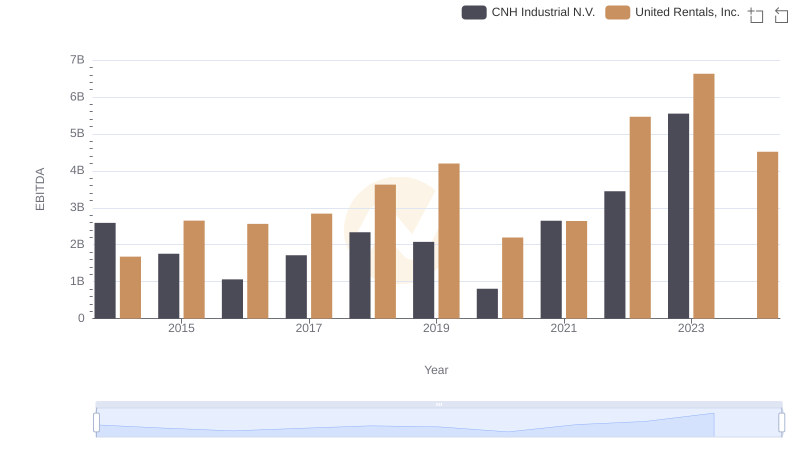
Comprehensive EBITDA Comparison: United Rentals, Inc. vs CNH Industrial N.V.
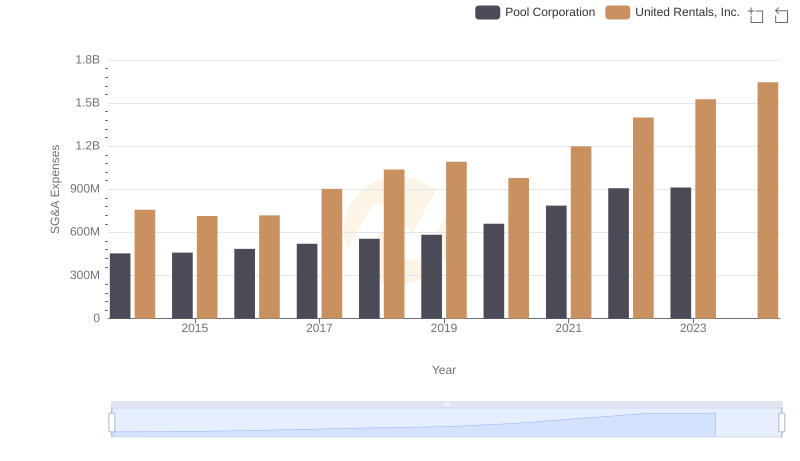
Cost Management Insights: SG&A Expenses for United Rentals, Inc. and Pool Corporation
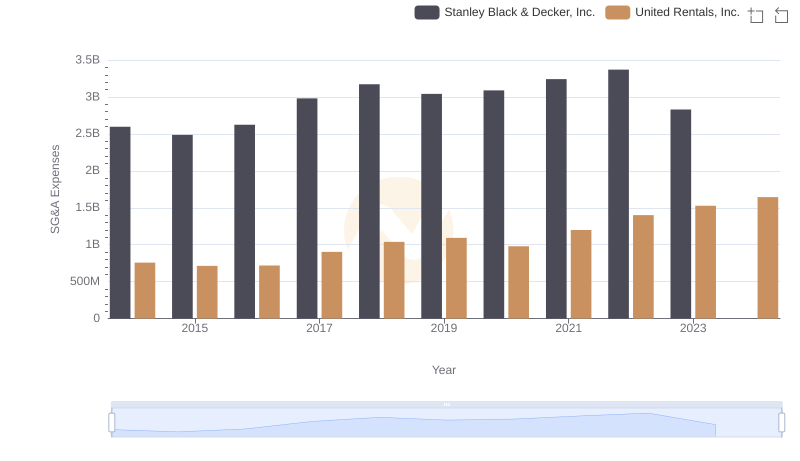
Cost Management Insights: SG&A Expenses for United Rentals, Inc. and Stanley Black & Decker, Inc.
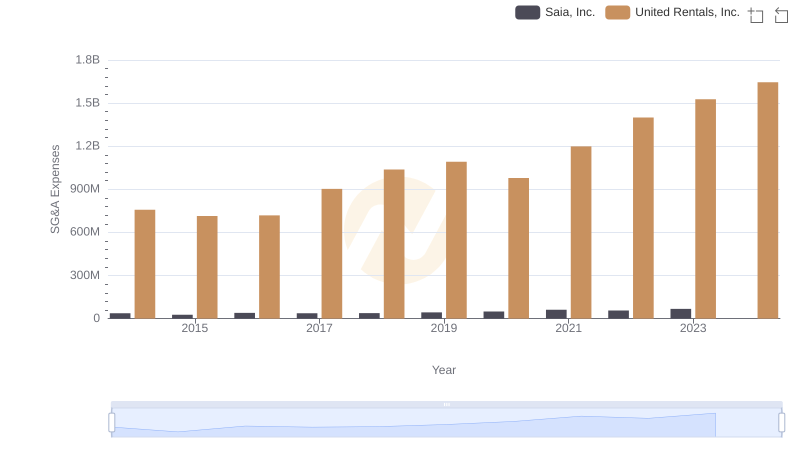
Breaking Down SG&A Expenses: United Rentals, Inc. vs Saia, Inc.
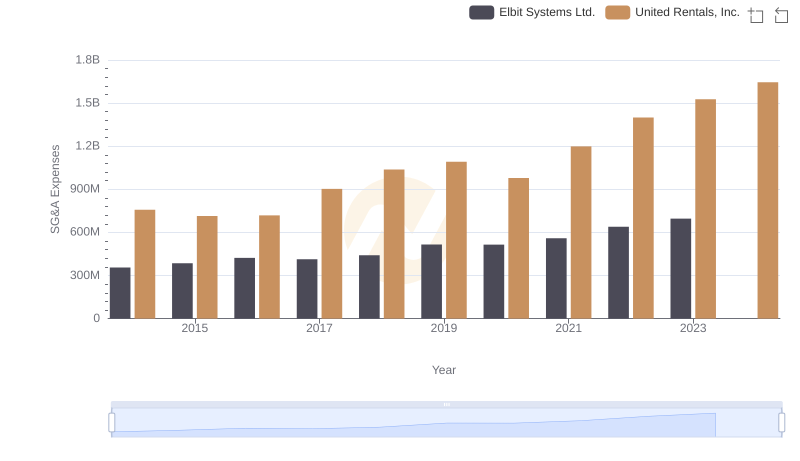
Operational Costs Compared: SG&A Analysis of United Rentals, Inc. and Elbit Systems Ltd.
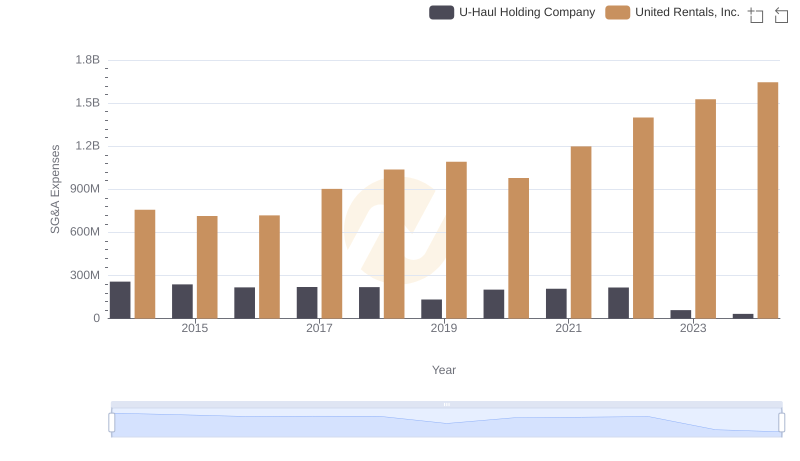
Comparing SG&A Expenses: United Rentals, Inc. vs U-Haul Holding Company Trends and Insights