| __timestamp | CNH Industrial N.V. | United Rentals, Inc. |
|---|---|---|
| Wednesday, January 1, 2014 | 7021000000 | 2432000000 |
| Thursday, January 1, 2015 | 5555000000 | 2480000000 |
| Friday, January 1, 2016 | 5333000000 | 2403000000 |
| Sunday, January 1, 2017 | 5740000000 | 2769000000 |
| Monday, January 1, 2018 | 6748000000 | 3364000000 |
| Tuesday, January 1, 2019 | 6247000000 | 3670000000 |
| Wednesday, January 1, 2020 | 4705000000 | 3183000000 |
| Friday, January 1, 2021 | 7477000000 | 3853000000 |
| Saturday, January 1, 2022 | 6754000000 | 4996000000 |
| Sunday, January 1, 2023 | 7889000000 | 5813000000 |
| Monday, January 1, 2024 | 6150000000 |
Infusing magic into the data realm
In the competitive landscape of industrial equipment, United Rentals, Inc. and CNH Industrial N.V. have shown distinct trajectories in their gross profit over the past decade. From 2014 to 2023, CNH Industrial's gross profit fluctuated, peaking in 2023 with a 12% increase from 2022, while United Rentals demonstrated a consistent upward trend, culminating in a 45% rise over the same period. Notably, United Rentals surpassed the $6 billion mark in 2024, despite missing data for CNH Industrial that year. This analysis highlights United Rentals' robust growth strategy, contrasting with CNH Industrial's more variable performance. As the industry evolves, these trends offer valuable insights into the strategic positioning and market resilience of these two giants.
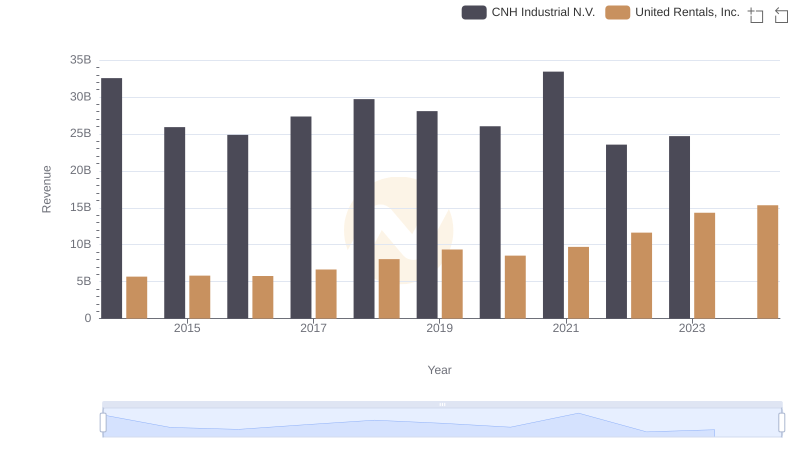
United Rentals, Inc. or CNH Industrial N.V.: Who Leads in Yearly Revenue?
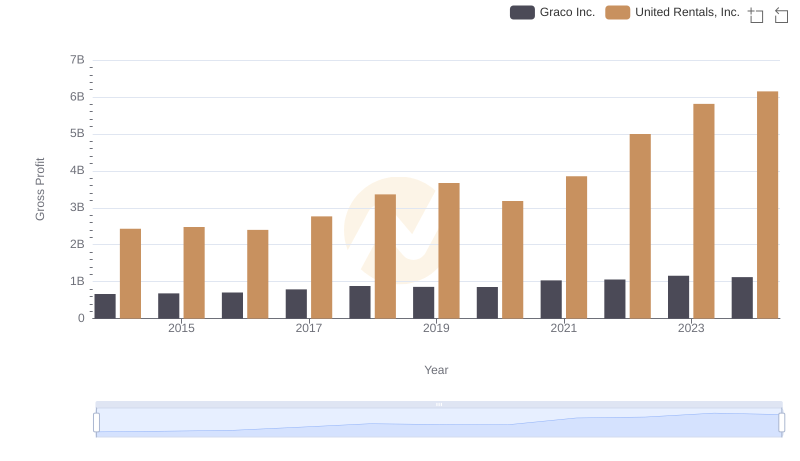
Gross Profit Comparison: United Rentals, Inc. and Graco Inc. Trends
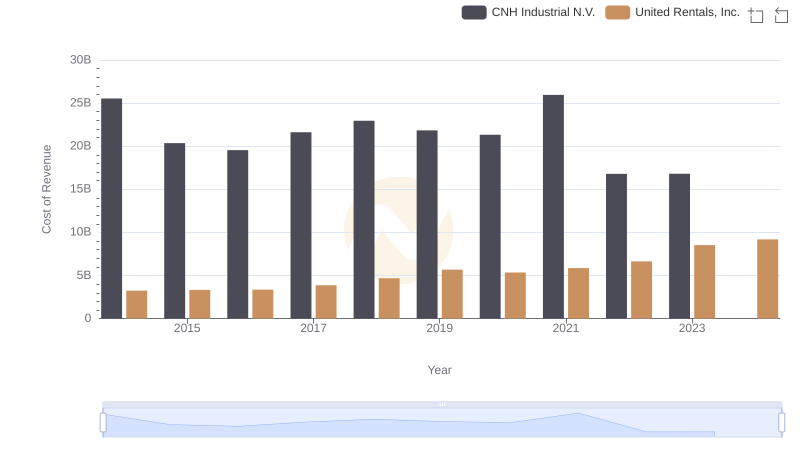
Comparing Cost of Revenue Efficiency: United Rentals, Inc. vs CNH Industrial N.V.
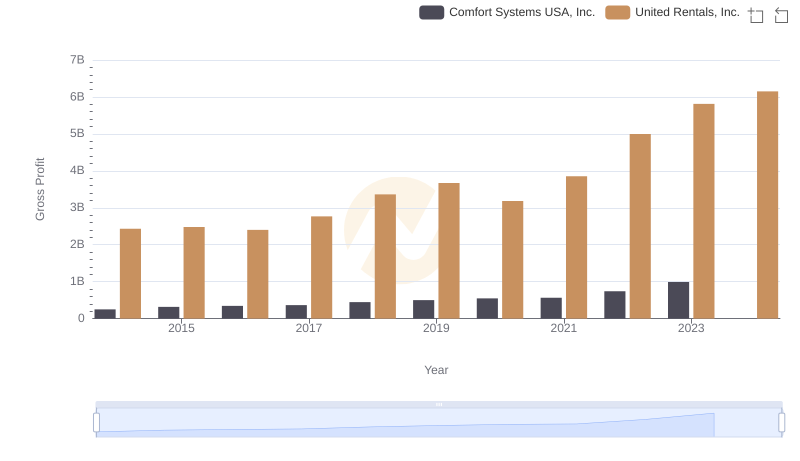
Gross Profit Trends Compared: United Rentals, Inc. vs Comfort Systems USA, Inc.
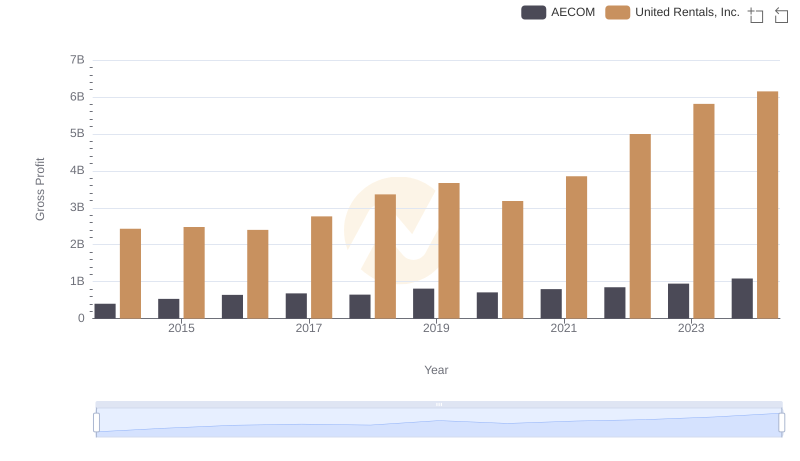
United Rentals, Inc. and AECOM: A Detailed Gross Profit Analysis
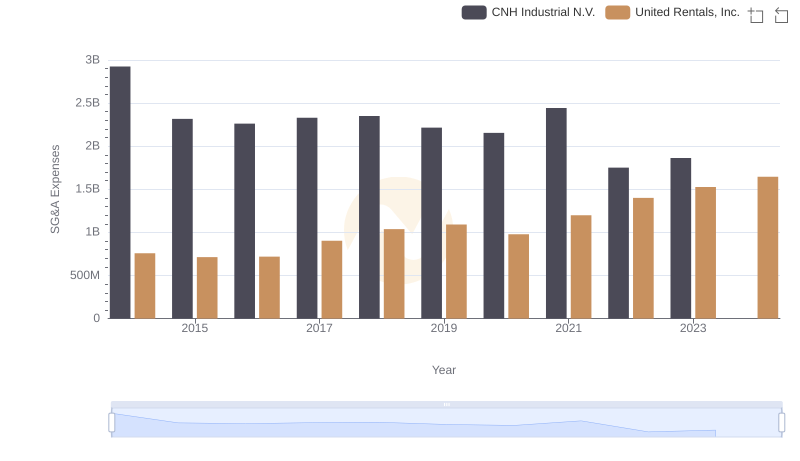
United Rentals, Inc. vs CNH Industrial N.V.: SG&A Expense Trends
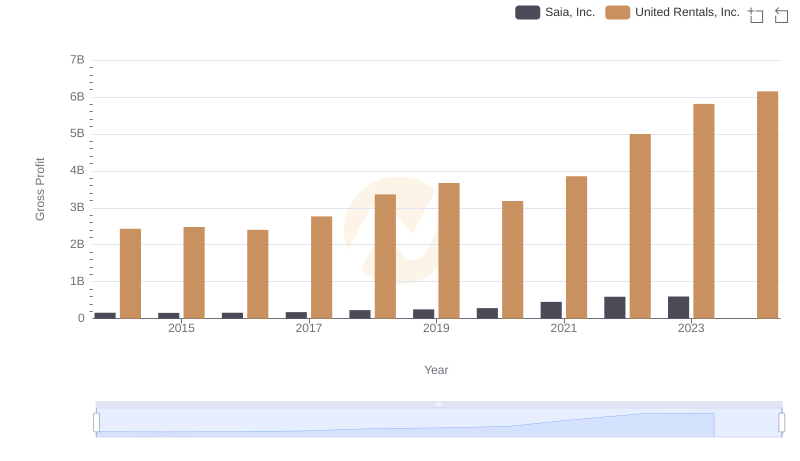
Gross Profit Comparison: United Rentals, Inc. and Saia, Inc. Trends

United Rentals, Inc. and Stanley Black & Decker, Inc.: A Detailed Gross Profit Analysis
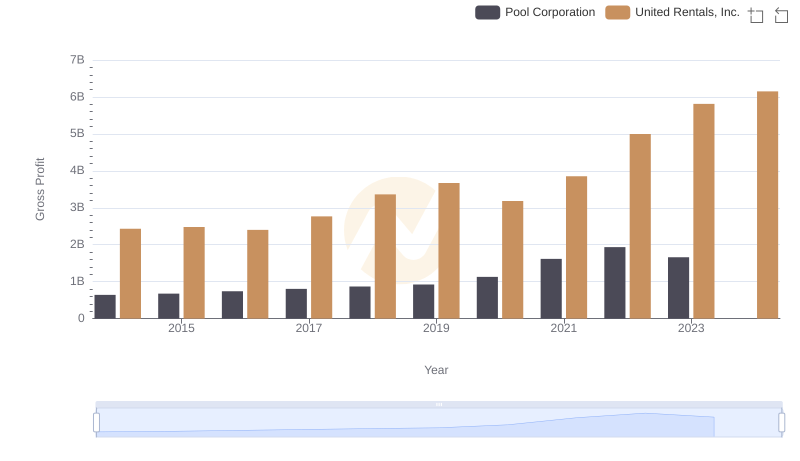
United Rentals, Inc. vs Pool Corporation: A Gross Profit Performance Breakdown

Gross Profit Comparison: United Rentals, Inc. and U-Haul Holding Company Trends
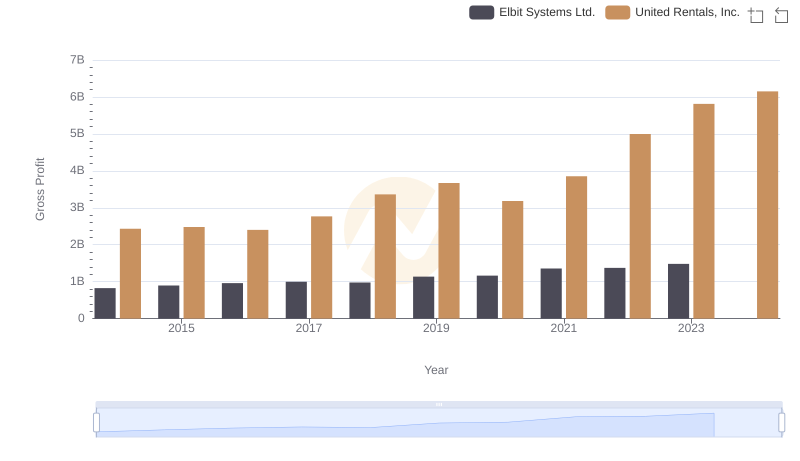
Gross Profit Analysis: Comparing United Rentals, Inc. and Elbit Systems Ltd.
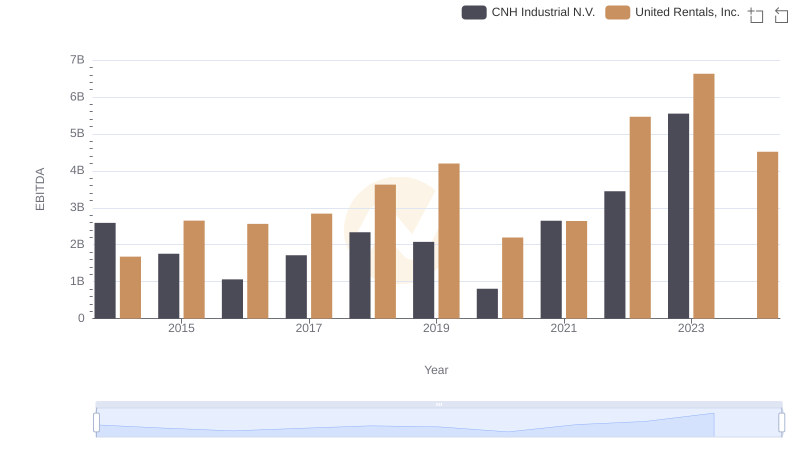
Comprehensive EBITDA Comparison: United Rentals, Inc. vs CNH Industrial N.V.