| __timestamp | Graco Inc. | United Rentals, Inc. |
|---|---|---|
| Wednesday, January 1, 2014 | 303565000 | 758000000 |
| Thursday, January 1, 2015 | 324016000 | 714000000 |
| Friday, January 1, 2016 | 341734000 | 719000000 |
| Sunday, January 1, 2017 | 372496000 | 903000000 |
| Monday, January 1, 2018 | 382988000 | 1038000000 |
| Tuesday, January 1, 2019 | 367743000 | 1092000000 |
| Wednesday, January 1, 2020 | 355796000 | 979000000 |
| Friday, January 1, 2021 | 422975000 | 1199000000 |
| Saturday, January 1, 2022 | 404731000 | 1400000000 |
| Sunday, January 1, 2023 | 432156000 | 1527000000 |
| Monday, January 1, 2024 | 465133000 | 1645000000 |
Cracking the code
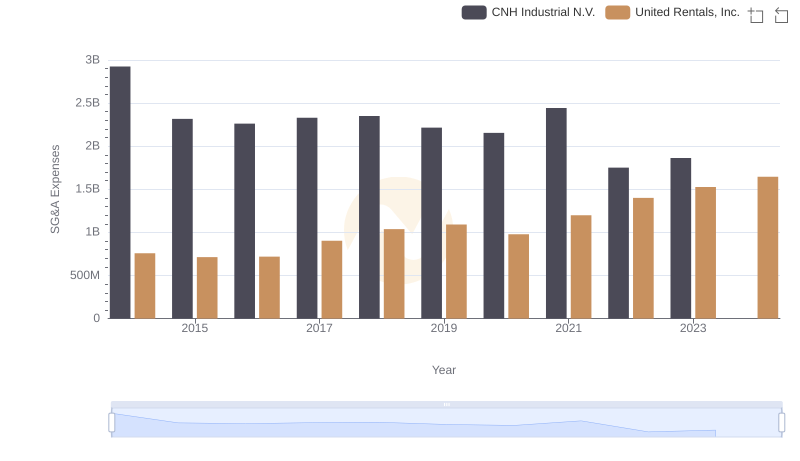
In the competitive landscape of industrial equipment, understanding SG&A (Selling, General, and Administrative) efficiency is crucial. United Rentals, Inc. and Graco Inc. offer a fascinating comparison over the past decade. From 2014 to 2024, United Rentals has consistently outpaced Graco in SG&A expenses, reflecting its expansive growth strategy. In 2023, United Rentals' SG&A expenses were approximately 252% higher than Graco's, highlighting its larger operational scale. However, Graco's steady increase in SG&A, peaking at a 53% rise from 2014 to 2024, underscores its strategic investments in efficiency and market presence. This analysis provides a window into how these industry giants allocate resources to maintain competitive edges. As we look to the future, monitoring these trends will be key to understanding their evolving business strategies.
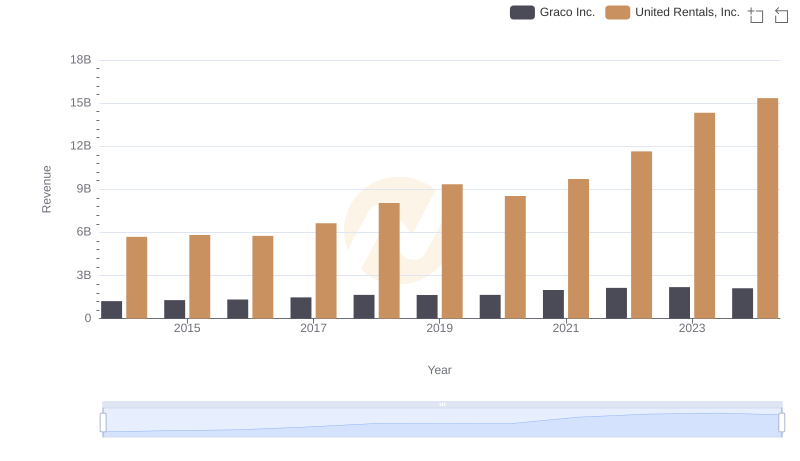
Who Generates More Revenue? United Rentals, Inc. or Graco Inc.
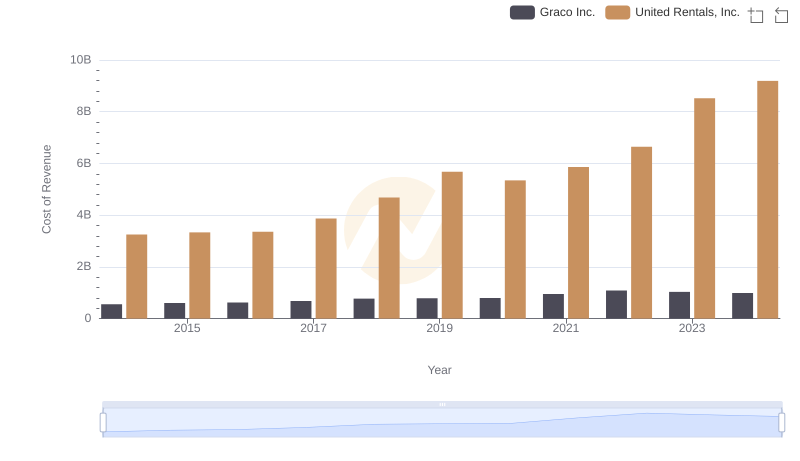
Analyzing Cost of Revenue: United Rentals, Inc. and Graco Inc.

Breaking Down SG&A Expenses: United Rentals, Inc. vs Expeditors International of Washington, Inc.
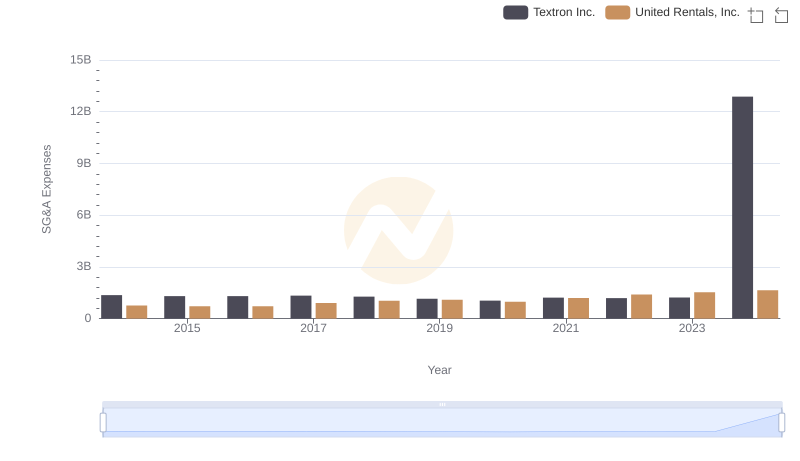
Comparing SG&A Expenses: United Rentals, Inc. vs Textron Inc. Trends and Insights
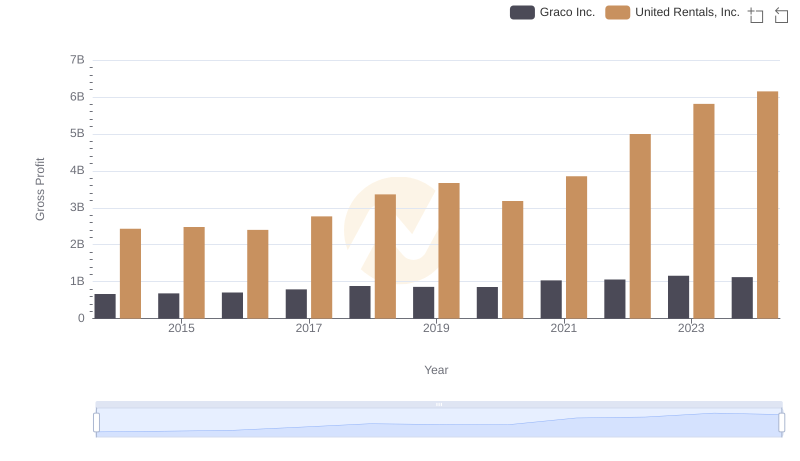
Gross Profit Comparison: United Rentals, Inc. and Graco Inc. Trends
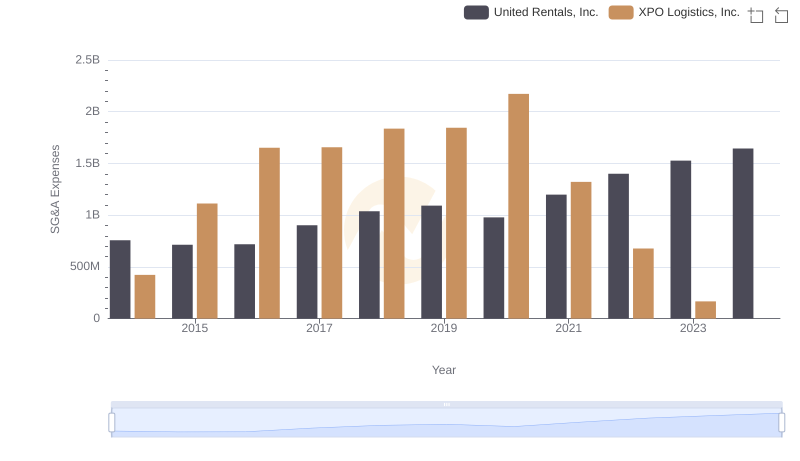
Operational Costs Compared: SG&A Analysis of United Rentals, Inc. and XPO Logistics, Inc.
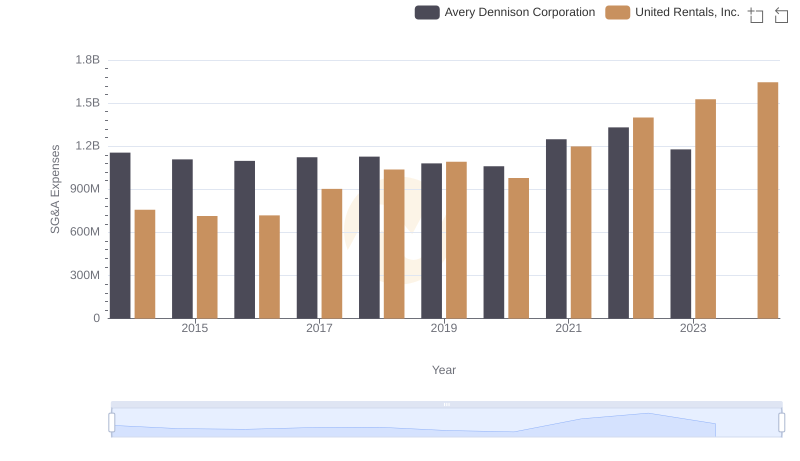
United Rentals, Inc. or Avery Dennison Corporation: Who Manages SG&A Costs Better?
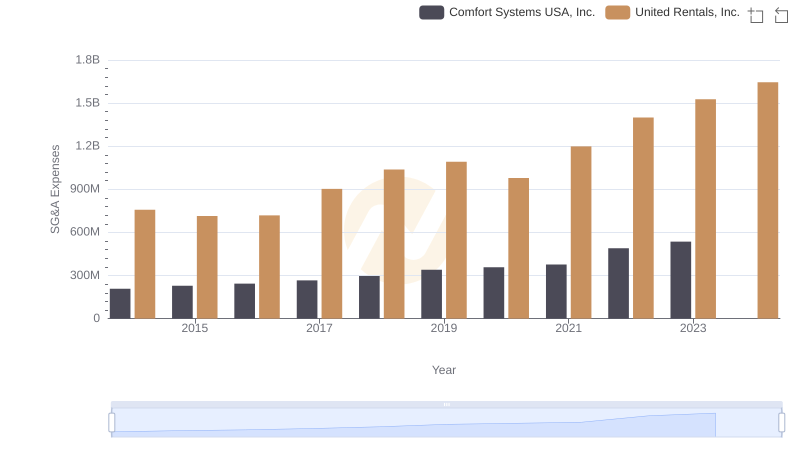
United Rentals, Inc. and Comfort Systems USA, Inc.: SG&A Spending Patterns Compared
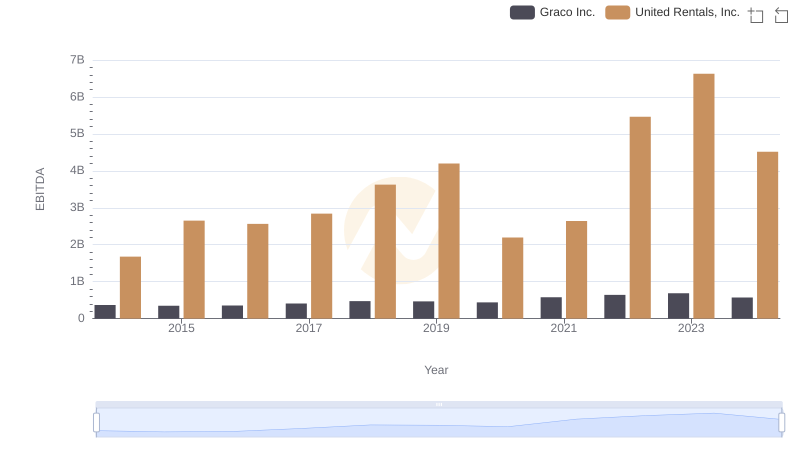
EBITDA Analysis: Evaluating United Rentals, Inc. Against Graco Inc.
United Rentals, Inc. vs CNH Industrial N.V.: SG&A Expense Trends