| __timestamp | Stanley Black & Decker, Inc. | United Airlines Holdings, Inc. |
|---|---|---|
| Wednesday, January 1, 2014 | 11338600000 | 38901000000 |
| Thursday, January 1, 2015 | 11171800000 | 37864000000 |
| Friday, January 1, 2016 | 11406900000 | 36556000000 |
| Sunday, January 1, 2017 | 12747200000 | 37736000000 |
| Monday, January 1, 2018 | 13982400000 | 41303000000 |
| Tuesday, January 1, 2019 | 14442200000 | 43259000000 |
| Wednesday, January 1, 2020 | 14534600000 | 15355000000 |
| Friday, January 1, 2021 | 15617200000 | 24634000000 |
| Saturday, January 1, 2022 | 16947400000 | 44955000000 |
| Sunday, January 1, 2023 | 15781100000 | 53717000000 |
| Monday, January 1, 2024 | 15365700000 | 57063000000 |
Unleashing insights
In the ever-evolving landscape of American industry, United Airlines Holdings, Inc. and Stanley Black & Decker, Inc. stand as titans in their respective fields. Over the past decade, these companies have navigated the turbulent waters of economic shifts and global challenges. From 2014 to 2023, United Airlines saw a remarkable 38% increase in revenue, peaking in 2023, despite a significant dip in 2020 due to the pandemic. Meanwhile, Stanley Black & Decker experienced a steady growth of approximately 39% over the same period, showcasing resilience and adaptability.
The data reveals a fascinating narrative of recovery and growth. United Airlines' revenue plummeted in 2020, reflecting the global travel restrictions, but rebounded strongly by 2023. In contrast, Stanley Black & Decker maintained a consistent upward trajectory, highlighting its robust business model. This comparison underscores the dynamic nature of these industries and their ability to adapt to changing market conditions.
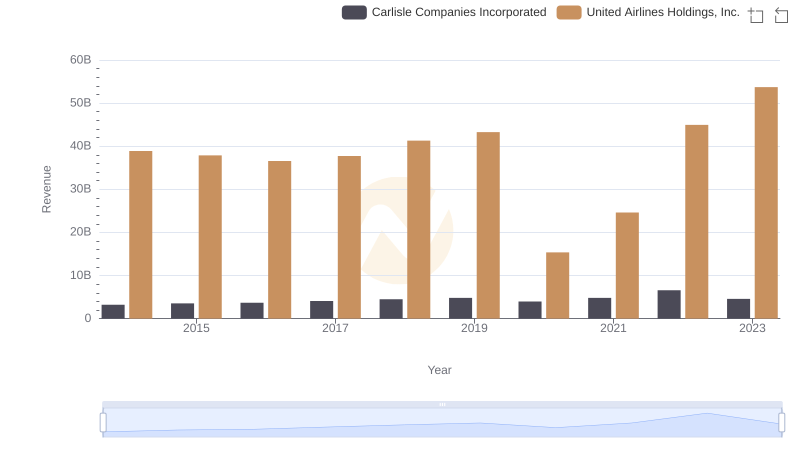
United Airlines Holdings, Inc. or Carlisle Companies Incorporated: Who Leads in Yearly Revenue?
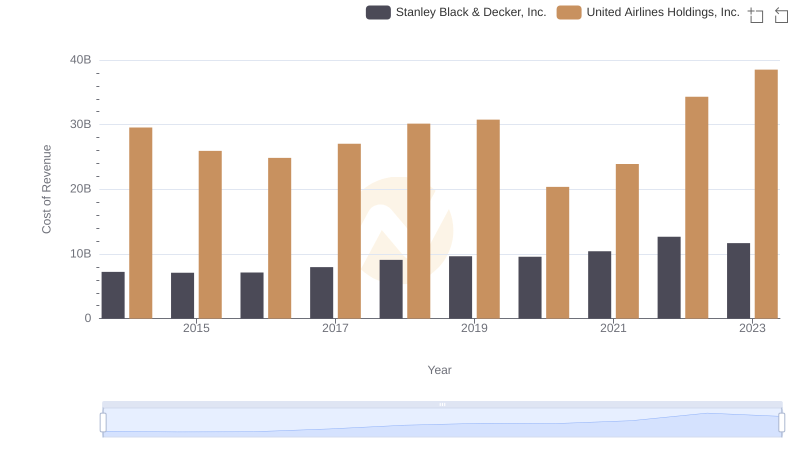
Comparing Cost of Revenue Efficiency: United Airlines Holdings, Inc. vs Stanley Black & Decker, Inc.
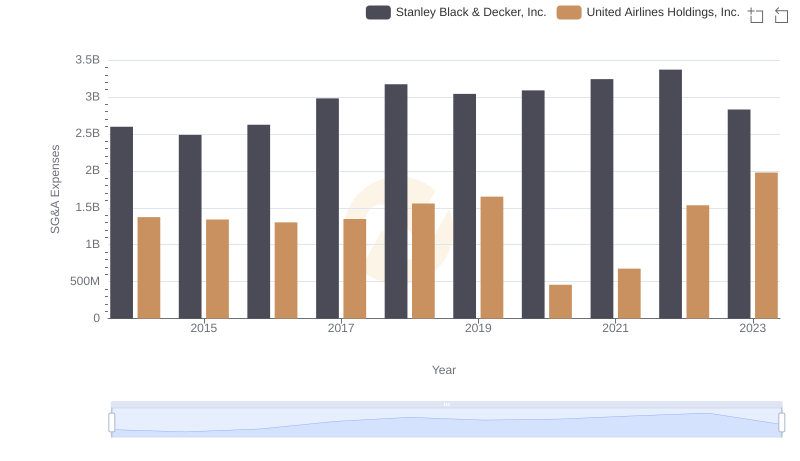
Cost Management Insights: SG&A Expenses for United Airlines Holdings, Inc. and Stanley Black & Decker, Inc.

United Airlines Holdings, Inc. vs Stanley Black & Decker, Inc.: Efficiency in Cost of Revenue Explored