| __timestamp | CNH Industrial N.V. | United Airlines Holdings, Inc. |
|---|---|---|
| Wednesday, January 1, 2014 | 2925000000 | 1373000000 |
| Thursday, January 1, 2015 | 2317000000 | 1342000000 |
| Friday, January 1, 2016 | 2262000000 | 1303000000 |
| Sunday, January 1, 2017 | 2330000000 | 1349000000 |
| Monday, January 1, 2018 | 2351000000 | 1558000000 |
| Tuesday, January 1, 2019 | 2216000000 | 1651000000 |
| Wednesday, January 1, 2020 | 2155000000 | 459000000 |
| Friday, January 1, 2021 | 2443000000 | 677000000 |
| Saturday, January 1, 2022 | 1752000000 | 1535000000 |
| Sunday, January 1, 2023 | 1863000000 | 1977000000 |
| Monday, January 1, 2024 | 2231000000 |
Igniting the spark of knowledge
In the ever-evolving landscape of corporate finance, understanding the trends in Selling, General, and Administrative (SG&A) expenses is crucial for investors and analysts alike. Over the past decade, United Airlines Holdings, Inc. and CNH Industrial N.V. have showcased distinct trajectories in their SG&A expenditures.
From 2014 to 2023, CNH Industrial's SG&A expenses have seen a notable decline of approximately 36%, from a peak in 2014 to a low in 2022. This reduction reflects strategic cost management and operational efficiencies. In contrast, United Airlines experienced a 44% increase in SG&A expenses over the same period, with a significant dip in 2020, likely due to the pandemic's impact on the airline industry. By 2023, United Airlines' SG&A expenses rebounded, surpassing CNH Industrial's for the first time in this period.
These trends highlight the differing strategic priorities and market conditions faced by these two industry giants. For investors, understanding these dynamics is key to making informed decisions.
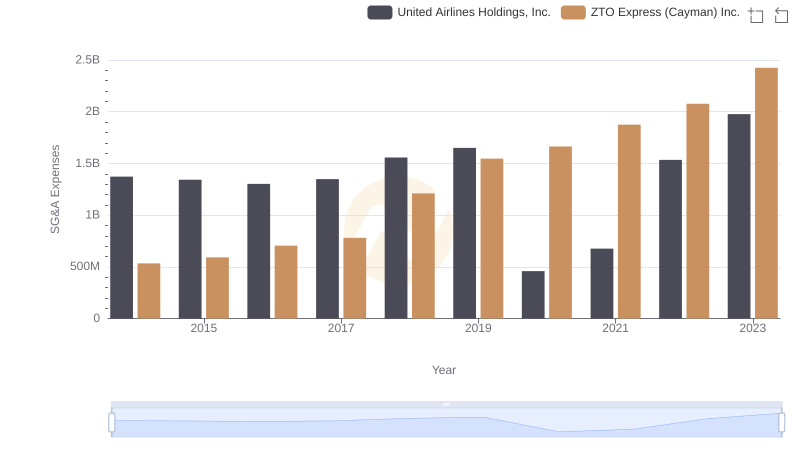
Selling, General, and Administrative Costs: United Airlines Holdings, Inc. vs ZTO Express (Cayman) Inc.
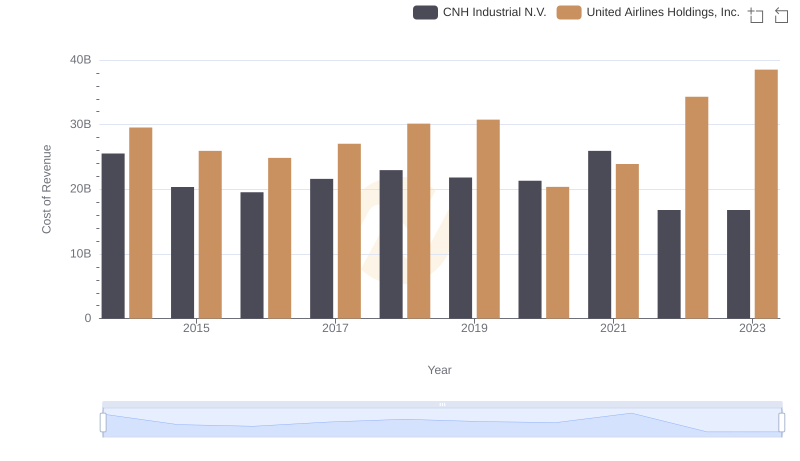
Cost Insights: Breaking Down United Airlines Holdings, Inc. and CNH Industrial N.V.'s Expenses
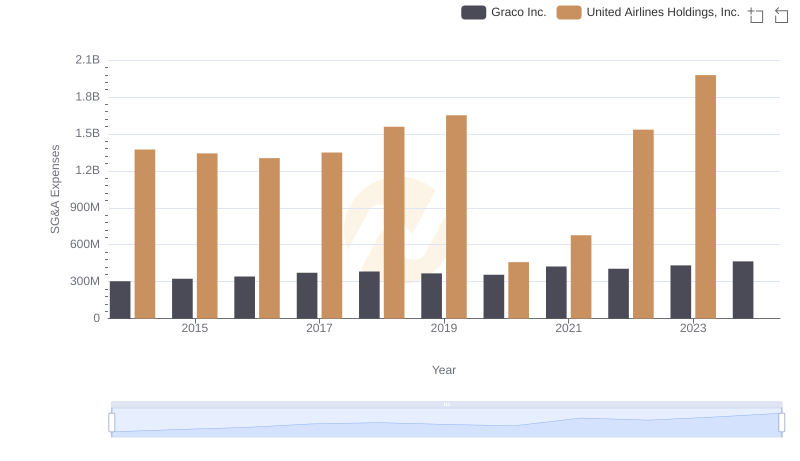
United Airlines Holdings, Inc. or Graco Inc.: Who Manages SG&A Costs Better?
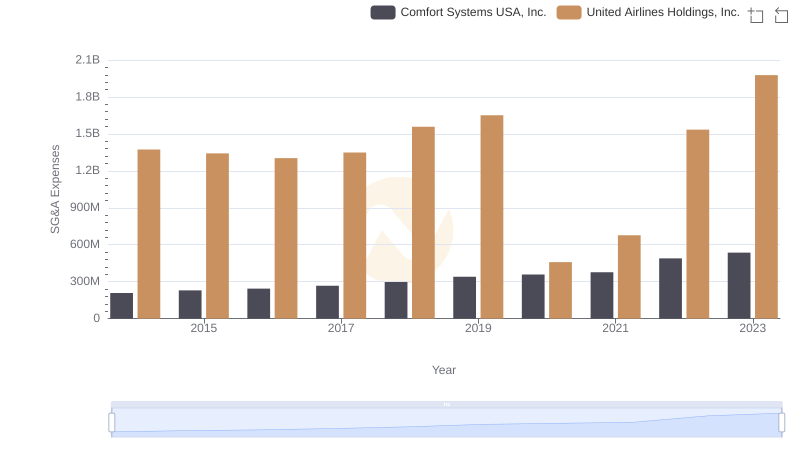
Breaking Down SG&A Expenses: United Airlines Holdings, Inc. vs Comfort Systems USA, Inc.
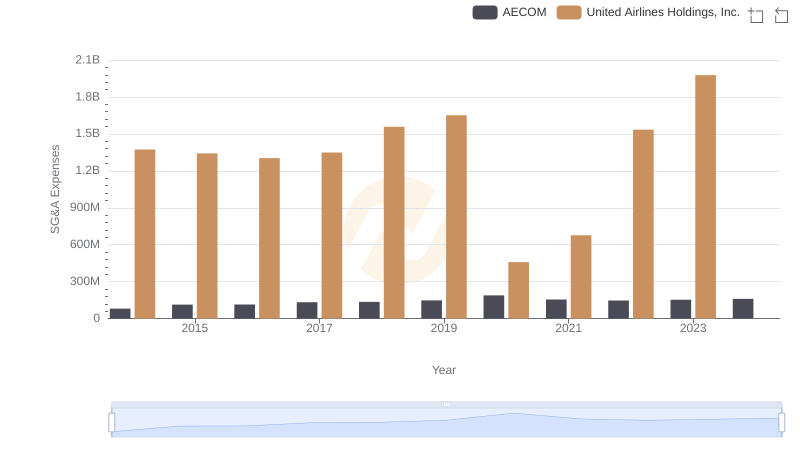
Breaking Down SG&A Expenses: United Airlines Holdings, Inc. vs AECOM
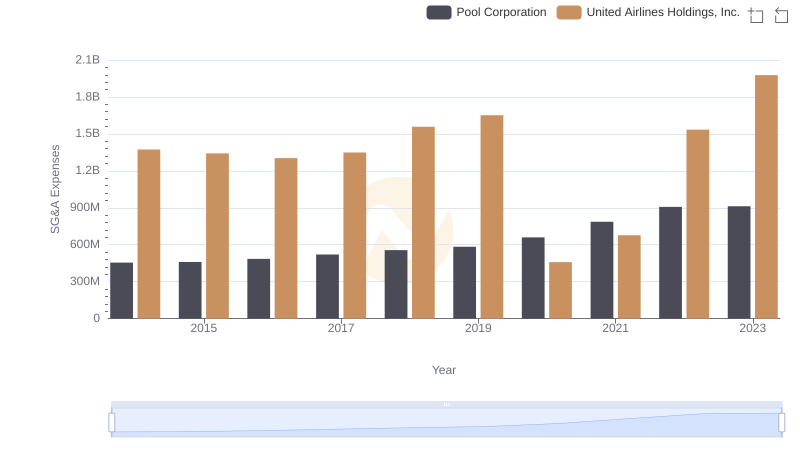
SG&A Efficiency Analysis: Comparing United Airlines Holdings, Inc. and Pool Corporation
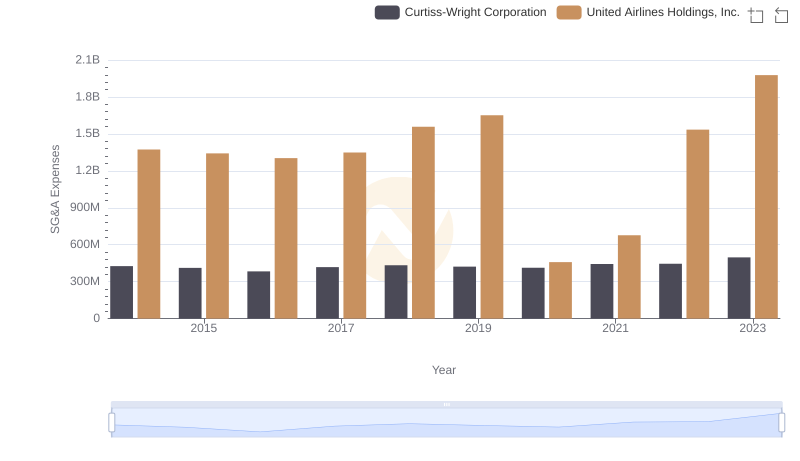
Comparing SG&A Expenses: United Airlines Holdings, Inc. vs Curtiss-Wright Corporation Trends and Insights
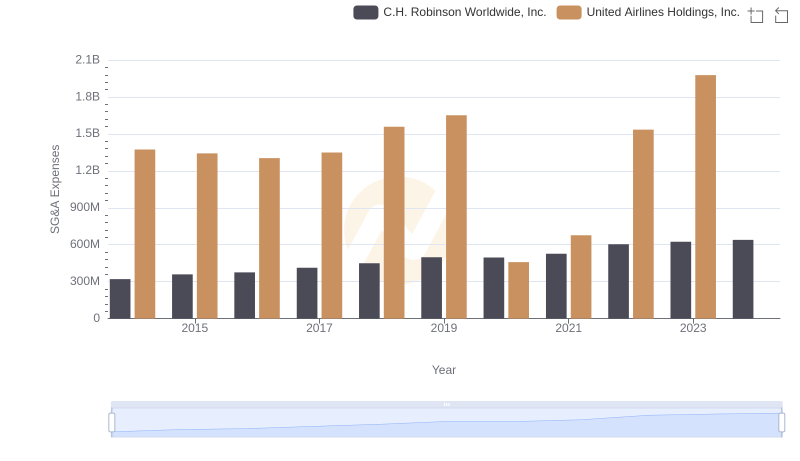
United Airlines Holdings, Inc. vs C.H. Robinson Worldwide, Inc.: SG&A Expense Trends