| __timestamp | Comfort Systems USA, Inc. | United Airlines Holdings, Inc. |
|---|---|---|
| Wednesday, January 1, 2014 | 207652000 | 1373000000 |
| Thursday, January 1, 2015 | 228965000 | 1342000000 |
| Friday, January 1, 2016 | 243201000 | 1303000000 |
| Sunday, January 1, 2017 | 266586000 | 1349000000 |
| Monday, January 1, 2018 | 296986000 | 1558000000 |
| Tuesday, January 1, 2019 | 340005000 | 1651000000 |
| Wednesday, January 1, 2020 | 357777000 | 459000000 |
| Friday, January 1, 2021 | 376309000 | 677000000 |
| Saturday, January 1, 2022 | 489344000 | 1535000000 |
| Sunday, January 1, 2023 | 536188999 | 1977000000 |
| Monday, January 1, 2024 | 2231000000 |
Data in motion
In the ever-evolving landscape of corporate finance, Selling, General, and Administrative (SG&A) expenses serve as a critical indicator of a company's operational efficiency. This analysis juxtaposes United Airlines Holdings, Inc. and Comfort Systems USA, Inc. from 2014 to 2023, revealing intriguing trends.
United Airlines, a titan in the aviation industry, consistently reported higher SG&A expenses, peaking in 2023 with a 44% increase from 2014. This reflects the airline's expansive operations and the challenges of managing a global workforce. In contrast, Comfort Systems USA, a leader in mechanical services, demonstrated a steady rise in SG&A expenses, culminating in a 158% increase over the same period. This growth underscores the company's strategic investments in expanding its service offerings.
The data highlights the distinct financial strategies of these companies, offering valuable insights into their operational priorities and market positioning.
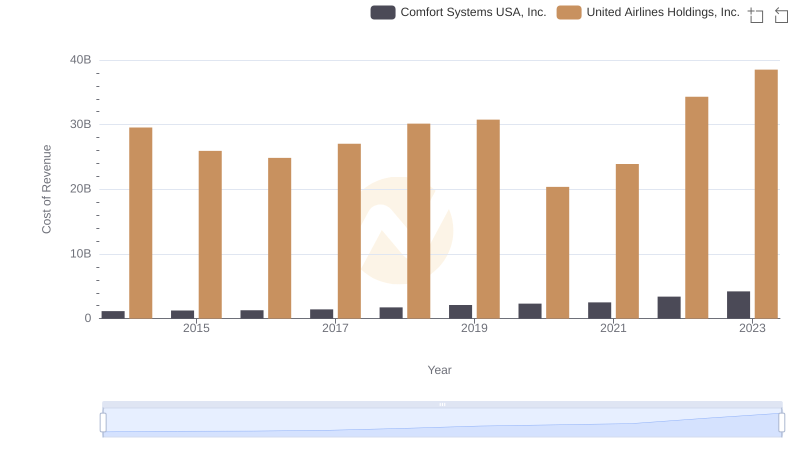
Cost of Revenue: Key Insights for United Airlines Holdings, Inc. and Comfort Systems USA, Inc.
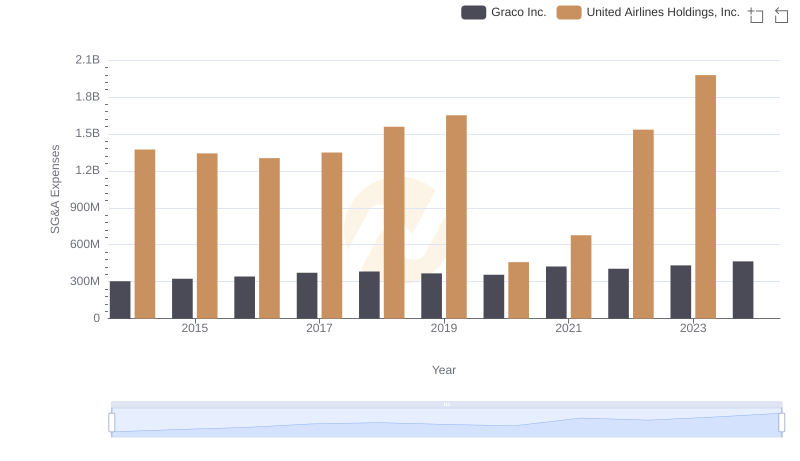
United Airlines Holdings, Inc. or Graco Inc.: Who Manages SG&A Costs Better?
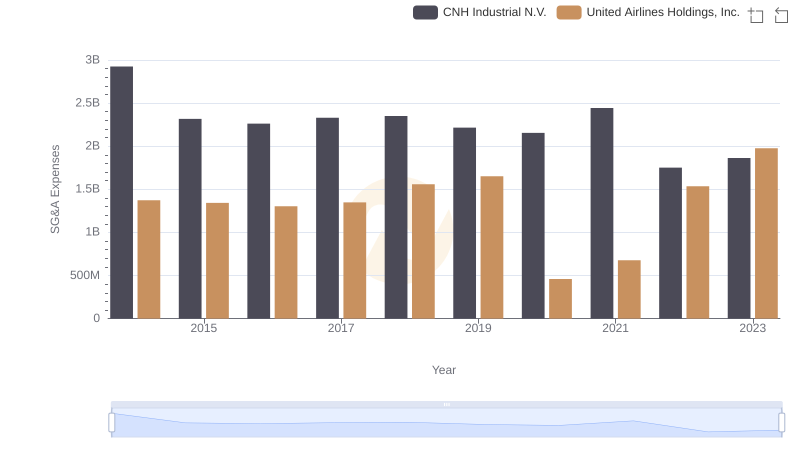
United Airlines Holdings, Inc. vs CNH Industrial N.V.: SG&A Expense Trends
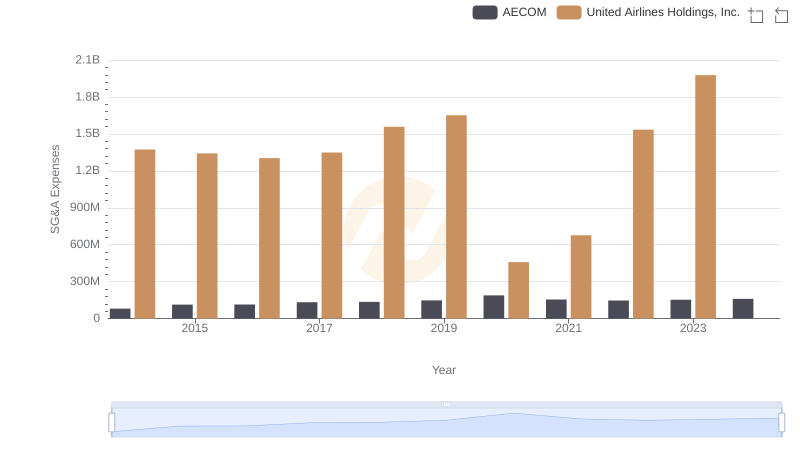
Breaking Down SG&A Expenses: United Airlines Holdings, Inc. vs AECOM
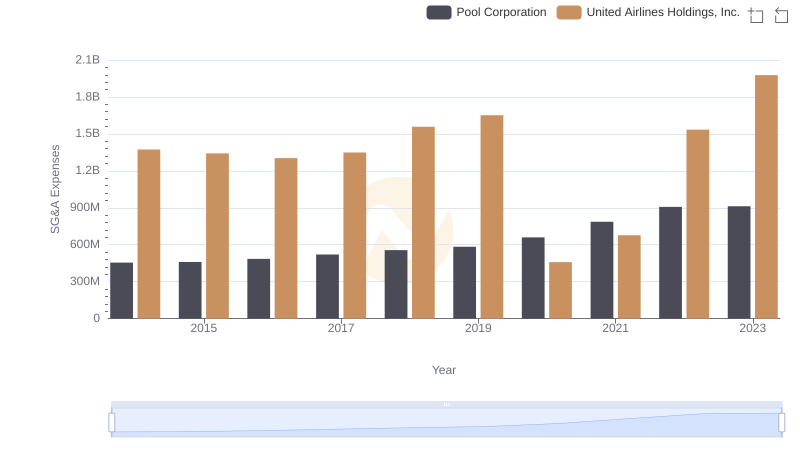
SG&A Efficiency Analysis: Comparing United Airlines Holdings, Inc. and Pool Corporation
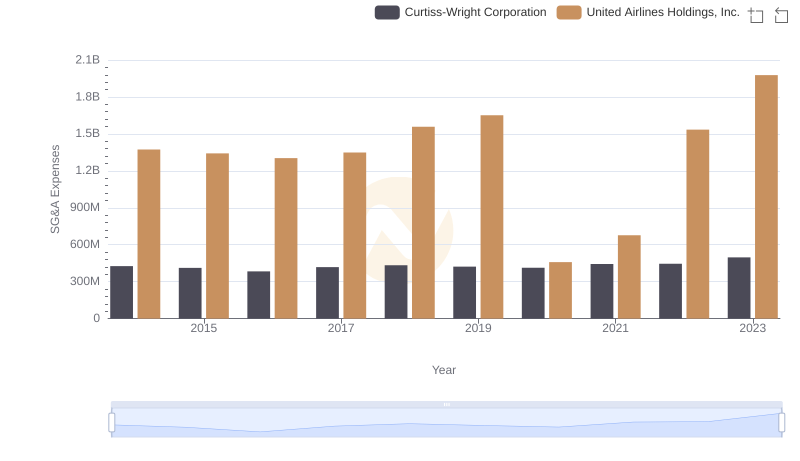
Comparing SG&A Expenses: United Airlines Holdings, Inc. vs Curtiss-Wright Corporation Trends and Insights
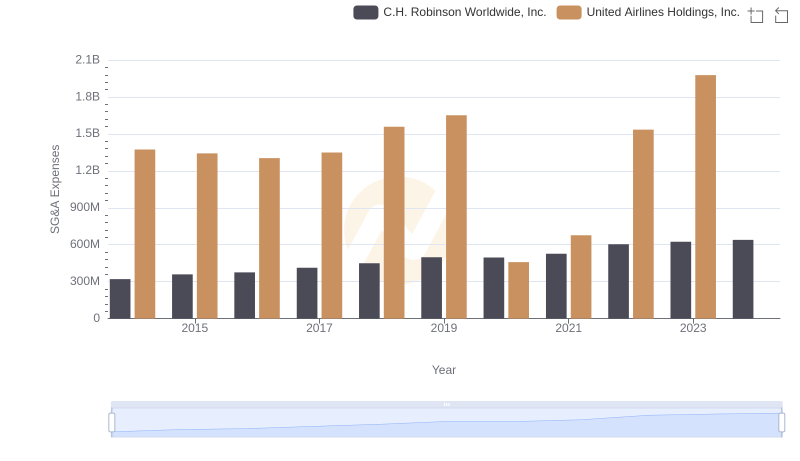
United Airlines Holdings, Inc. vs C.H. Robinson Worldwide, Inc.: SG&A Expense Trends
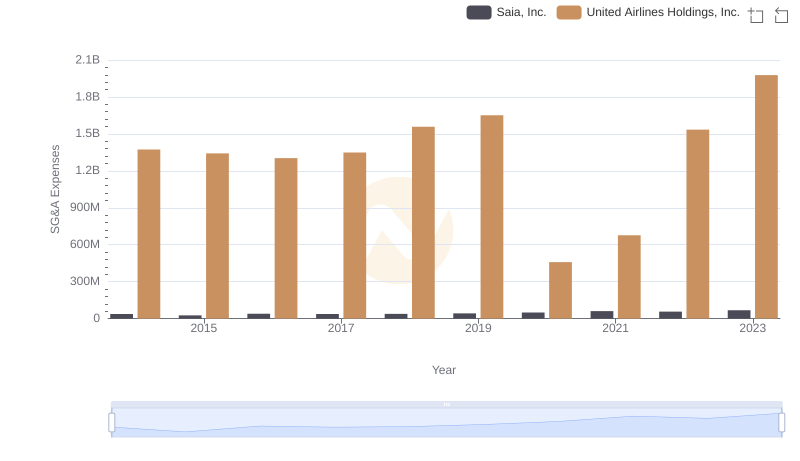
United Airlines Holdings, Inc. and Saia, Inc.: SG&A Spending Patterns Compared
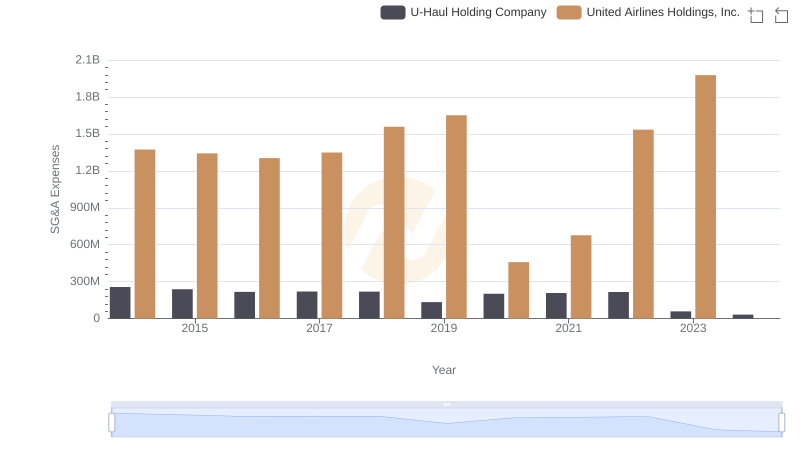
Comparing SG&A Expenses: United Airlines Holdings, Inc. vs U-Haul Holding Company Trends and Insights