| __timestamp | Pool Corporation | United Airlines Holdings, Inc. |
|---|---|---|
| Wednesday, January 1, 2014 | 454470000 | 1373000000 |
| Thursday, January 1, 2015 | 459422000 | 1342000000 |
| Friday, January 1, 2016 | 485228000 | 1303000000 |
| Sunday, January 1, 2017 | 520918000 | 1349000000 |
| Monday, January 1, 2018 | 556284000 | 1558000000 |
| Tuesday, January 1, 2019 | 583679000 | 1651000000 |
| Wednesday, January 1, 2020 | 659931000 | 459000000 |
| Friday, January 1, 2021 | 786808000 | 677000000 |
| Saturday, January 1, 2022 | 907629000 | 1535000000 |
| Sunday, January 1, 2023 | 912927000 | 1977000000 |
| Monday, January 1, 2024 | 2231000000 |
Cracking the code
In the world of corporate finance, Selling, General, and Administrative (SG&A) expenses are a critical measure of operational efficiency. This analysis compares United Airlines Holdings, Inc. and Pool Corporation from 2014 to 2023. Over this period, United Airlines consistently reported higher SG&A expenses, peaking at nearly $2 billion in 2023, a 44% increase from 2014. In contrast, Pool Corporation's SG&A expenses grew by approximately 101%, reaching $913 million in 2023.
This comparison highlights the diverse strategies and market conditions impacting these companies, offering valuable insights for investors and analysts alike.
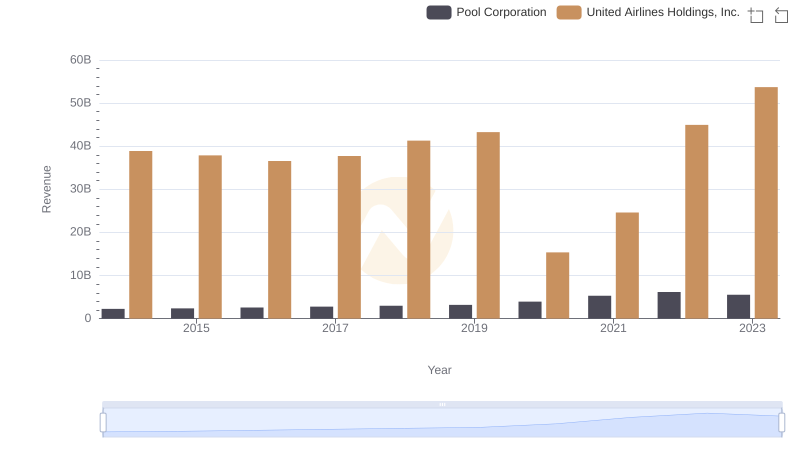
Revenue Showdown: United Airlines Holdings, Inc. vs Pool Corporation
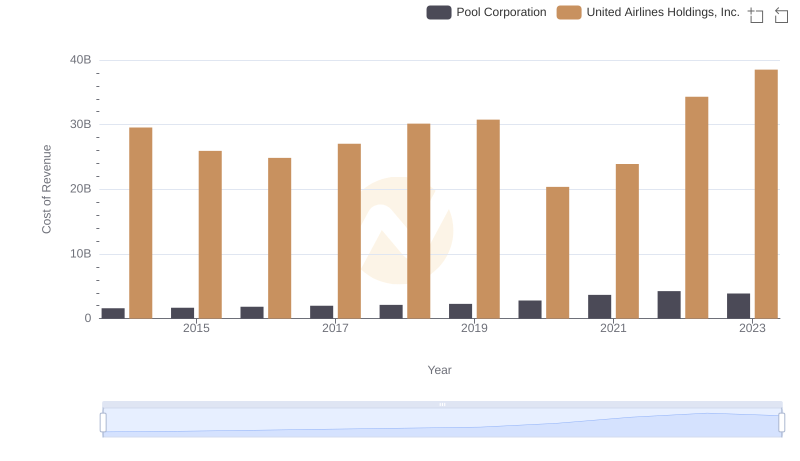
Cost Insights: Breaking Down United Airlines Holdings, Inc. and Pool Corporation's Expenses
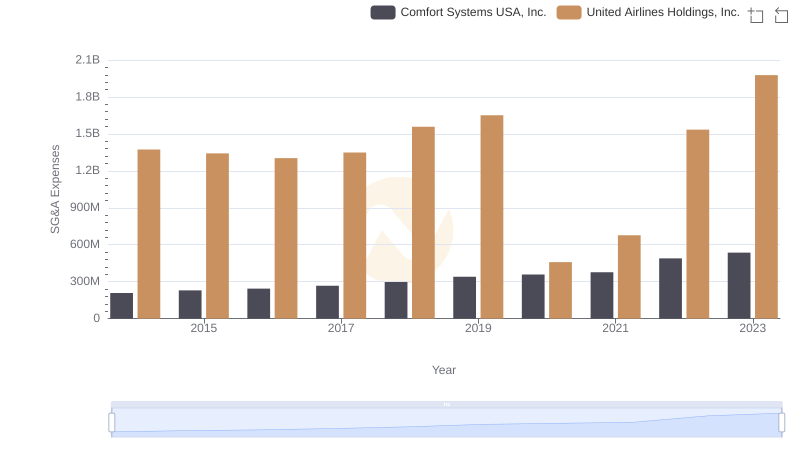
Breaking Down SG&A Expenses: United Airlines Holdings, Inc. vs Comfort Systems USA, Inc.
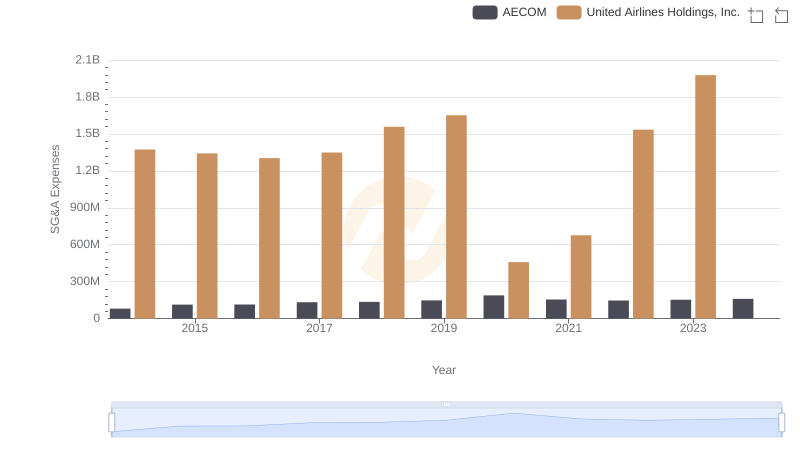
Breaking Down SG&A Expenses: United Airlines Holdings, Inc. vs AECOM
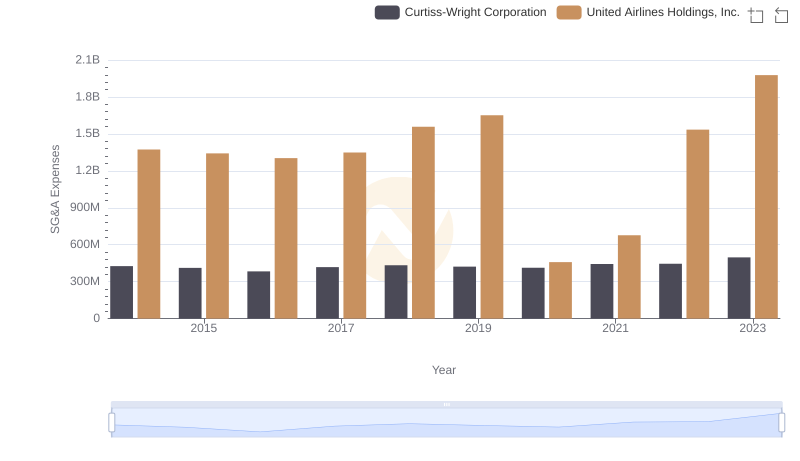
Comparing SG&A Expenses: United Airlines Holdings, Inc. vs Curtiss-Wright Corporation Trends and Insights
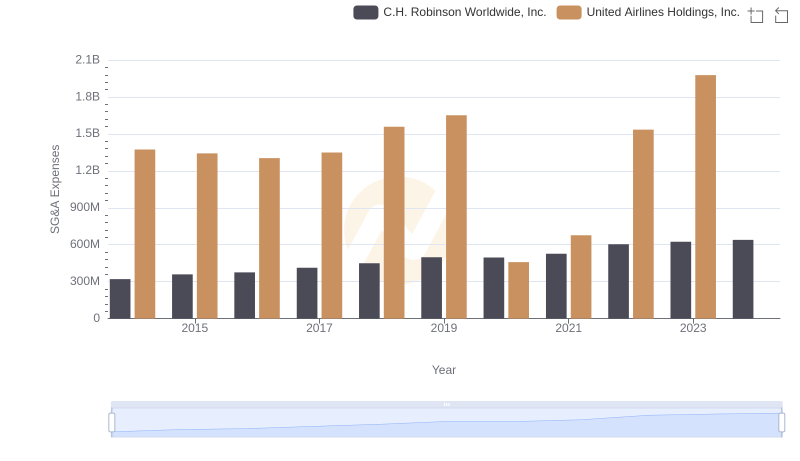
United Airlines Holdings, Inc. vs C.H. Robinson Worldwide, Inc.: SG&A Expense Trends
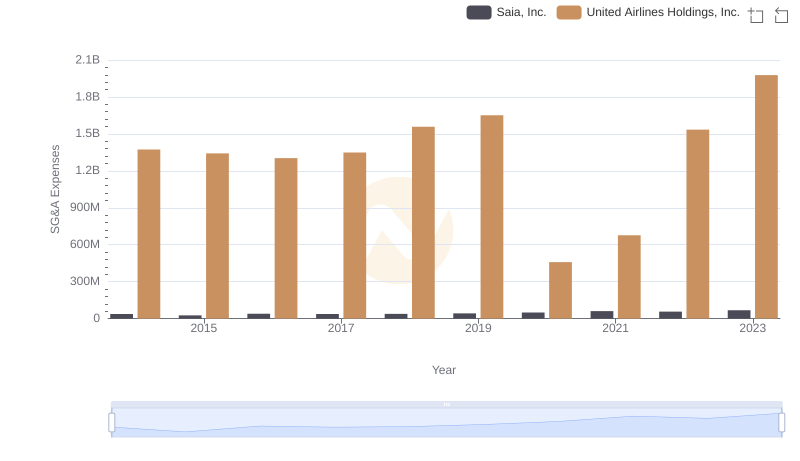
United Airlines Holdings, Inc. and Saia, Inc.: SG&A Spending Patterns Compared
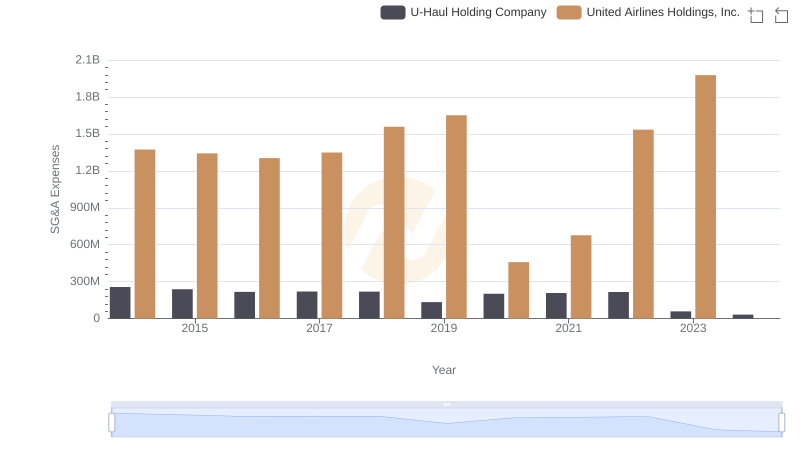
Comparing SG&A Expenses: United Airlines Holdings, Inc. vs U-Haul Holding Company Trends and Insights
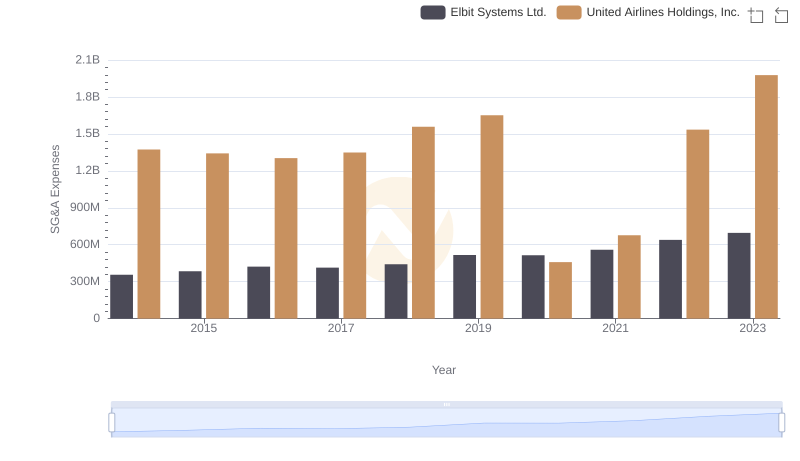
United Airlines Holdings, Inc. and Elbit Systems Ltd.: SG&A Spending Patterns Compared