| __timestamp | CNH Industrial N.V. | United Airlines Holdings, Inc. |
|---|---|---|
| Wednesday, January 1, 2014 | 25534000000 | 29569000000 |
| Thursday, January 1, 2015 | 20357000000 | 25952000000 |
| Friday, January 1, 2016 | 19539000000 | 24856000000 |
| Sunday, January 1, 2017 | 21621000000 | 27056000000 |
| Monday, January 1, 2018 | 22958000000 | 30165000000 |
| Tuesday, January 1, 2019 | 21832000000 | 30786000000 |
| Wednesday, January 1, 2020 | 21327000000 | 20385000000 |
| Friday, January 1, 2021 | 25951000000 | 23913000000 |
| Saturday, January 1, 2022 | 16797000000 | 34315000000 |
| Sunday, January 1, 2023 | 16805000000 | 38518000000 |
| Monday, January 1, 2024 | 37643000000 |
Unleashing insights
In the ever-evolving landscape of global business, understanding cost structures is pivotal. This analysis delves into the cost of revenue trends for United Airlines Holdings, Inc. and CNH Industrial N.V. from 2014 to 2023. Over this decade, United Airlines consistently outpaced CNH Industrial in cost of revenue, peaking in 2023 with a 30% increase from its 2014 figures. Meanwhile, CNH Industrial experienced a more volatile journey, with a notable dip in 2022, marking a 34% decrease from its 2014 peak. This fluctuation highlights the diverse challenges faced by these industry giants. United Airlines' steady rise reflects its strategic adaptations in the aviation sector, while CNH Industrial's variability underscores the complexities of the industrial market. As businesses navigate the post-pandemic world, these insights offer a window into the financial strategies shaping their futures.
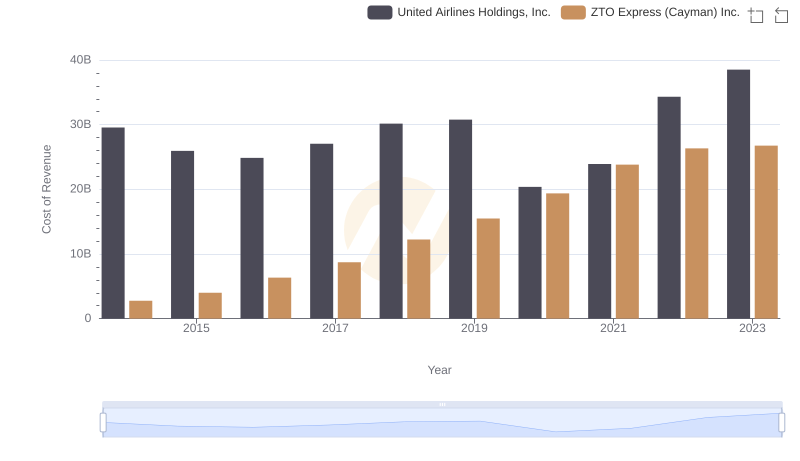
Cost Insights: Breaking Down United Airlines Holdings, Inc. and ZTO Express (Cayman) Inc.'s Expenses
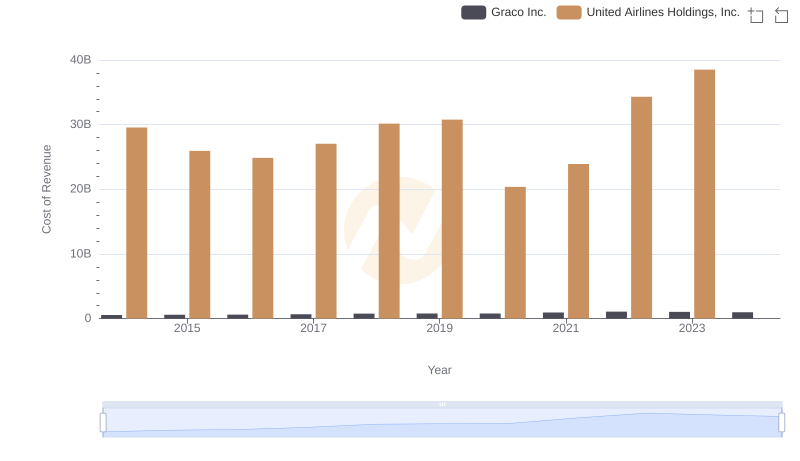
Cost Insights: Breaking Down United Airlines Holdings, Inc. and Graco Inc.'s Expenses
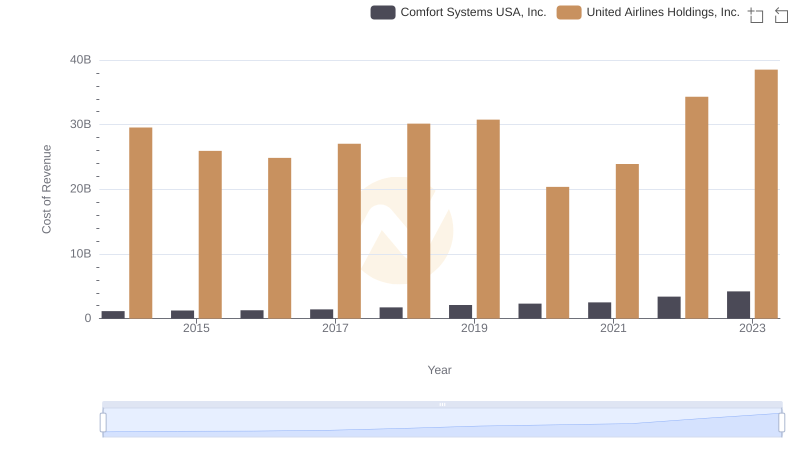
Cost of Revenue: Key Insights for United Airlines Holdings, Inc. and Comfort Systems USA, Inc.
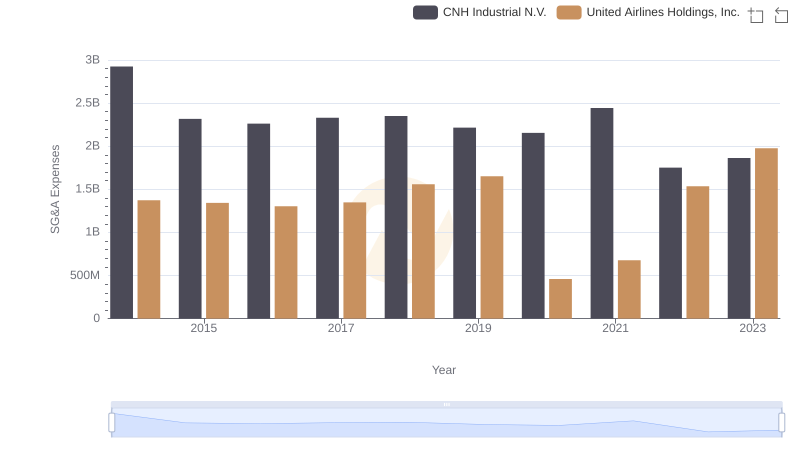
United Airlines Holdings, Inc. vs CNH Industrial N.V.: SG&A Expense Trends
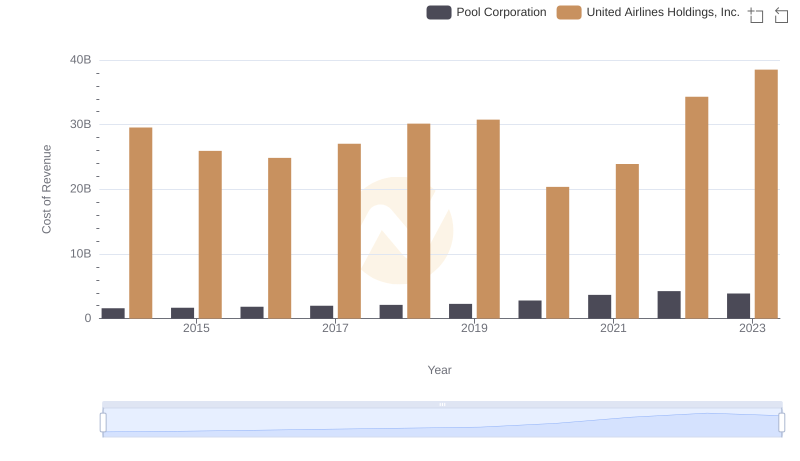
Cost Insights: Breaking Down United Airlines Holdings, Inc. and Pool Corporation's Expenses
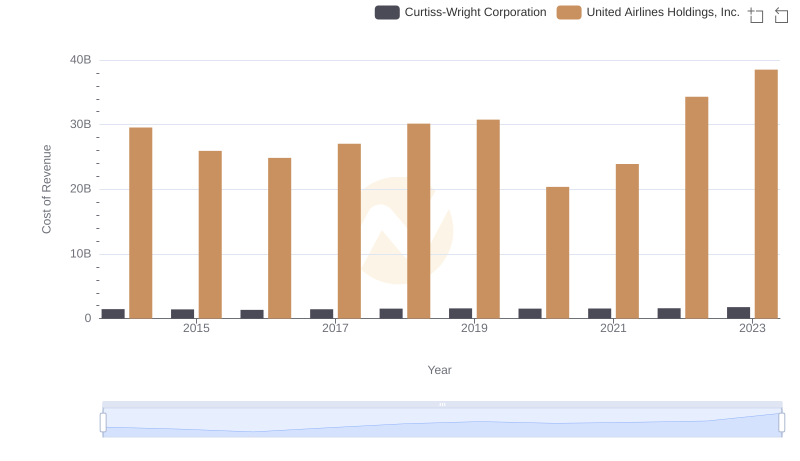
Cost of Revenue: Key Insights for United Airlines Holdings, Inc. and Curtiss-Wright Corporation
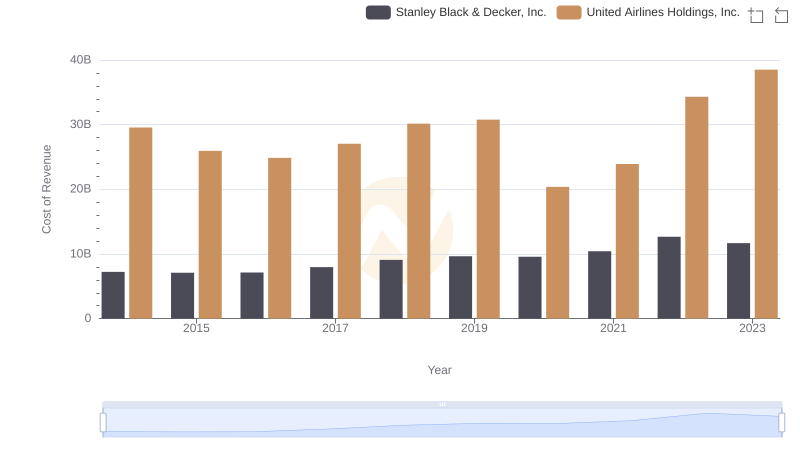
United Airlines Holdings, Inc. vs Stanley Black & Decker, Inc.: Efficiency in Cost of Revenue Explored