| __timestamp | AECOM | United Airlines Holdings, Inc. |
|---|---|---|
| Wednesday, January 1, 2014 | 80908000 | 1373000000 |
| Thursday, January 1, 2015 | 113975000 | 1342000000 |
| Friday, January 1, 2016 | 115088000 | 1303000000 |
| Sunday, January 1, 2017 | 133309000 | 1349000000 |
| Monday, January 1, 2018 | 135787000 | 1558000000 |
| Tuesday, January 1, 2019 | 148123000 | 1651000000 |
| Wednesday, January 1, 2020 | 188535000 | 459000000 |
| Friday, January 1, 2021 | 155072000 | 677000000 |
| Saturday, January 1, 2022 | 147309000 | 1535000000 |
| Sunday, January 1, 2023 | 153575000 | 1977000000 |
| Monday, January 1, 2024 | 160105000 | 2231000000 |
Unveiling the hidden dimensions of data
In the ever-evolving landscape of corporate finance, Selling, General, and Administrative (SG&A) expenses serve as a critical indicator of operational efficiency. This analysis juxtaposes United Airlines Holdings, Inc. and AECOM, two industry titans from aviation and engineering, respectively, over a decade from 2014 to 2023.
United Airlines, a leader in the aviation sector, consistently reported SG&A expenses that were approximately ten times higher than AECOM's, reflecting the capital-intensive nature of the airline industry. Notably, in 2020, United Airlines experienced a significant dip, with expenses dropping to just 34% of their 2019 levels, likely due to the pandemic's impact on air travel.
Conversely, AECOM's SG&A expenses showed a steady upward trend, peaking in 2020, and maintaining a consistent growth trajectory thereafter. This stability underscores AECOM's resilience and strategic management in the face of global economic challenges.
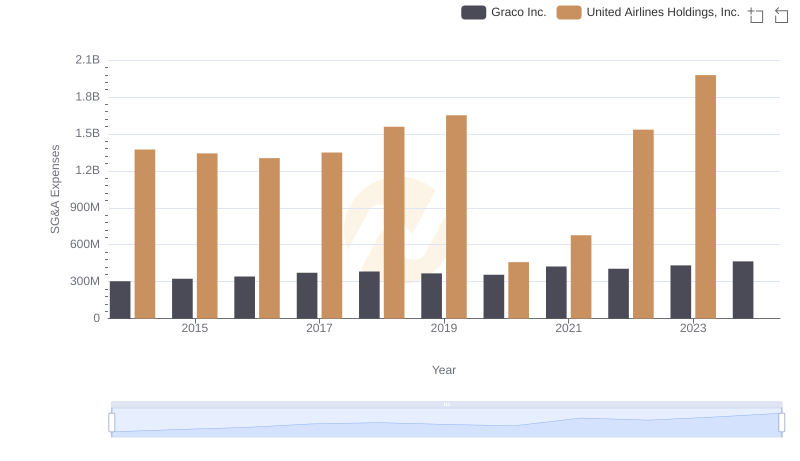
United Airlines Holdings, Inc. or Graco Inc.: Who Manages SG&A Costs Better?
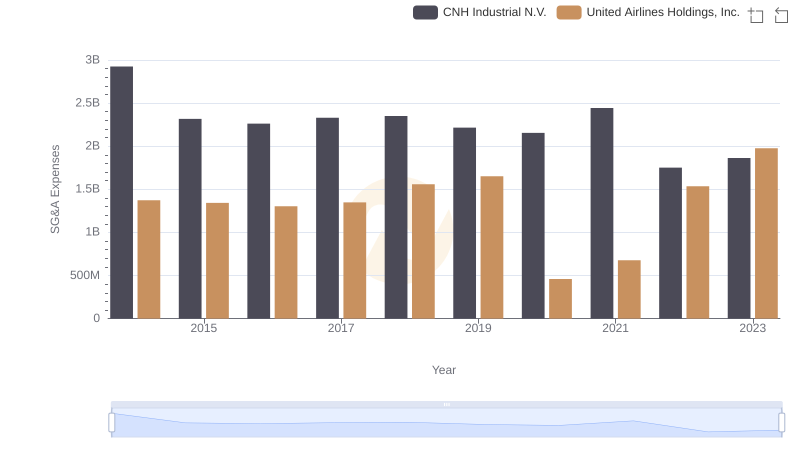
United Airlines Holdings, Inc. vs CNH Industrial N.V.: SG&A Expense Trends
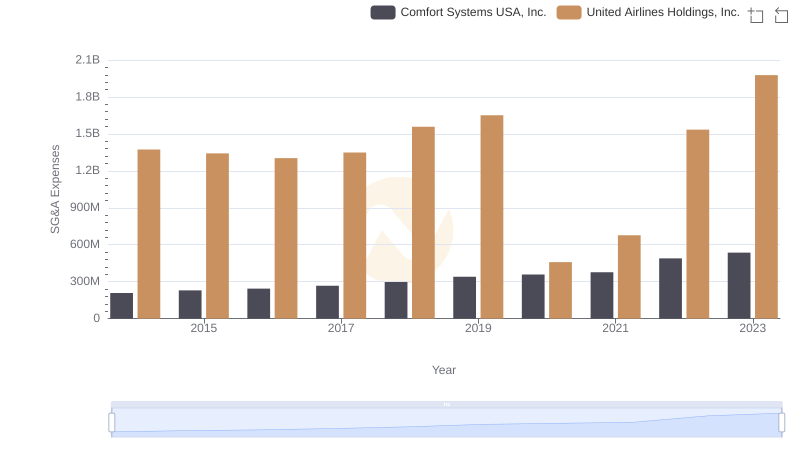
Breaking Down SG&A Expenses: United Airlines Holdings, Inc. vs Comfort Systems USA, Inc.
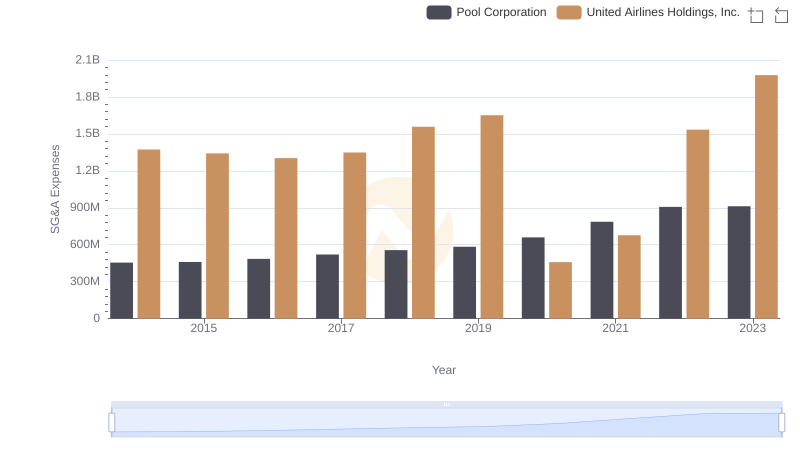
SG&A Efficiency Analysis: Comparing United Airlines Holdings, Inc. and Pool Corporation
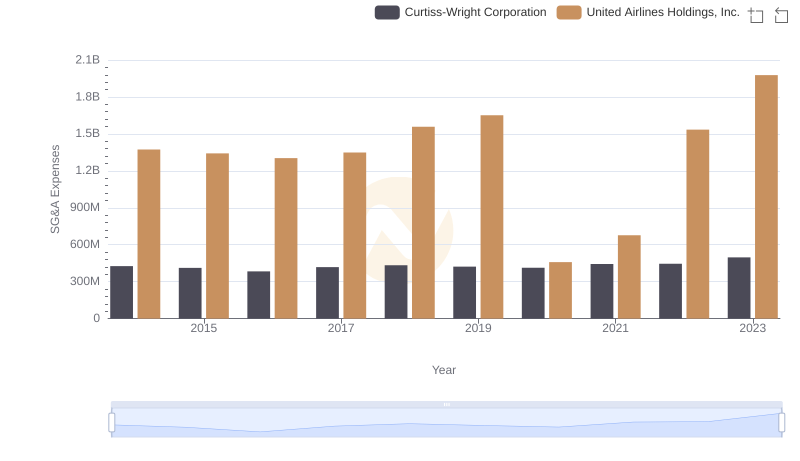
Comparing SG&A Expenses: United Airlines Holdings, Inc. vs Curtiss-Wright Corporation Trends and Insights
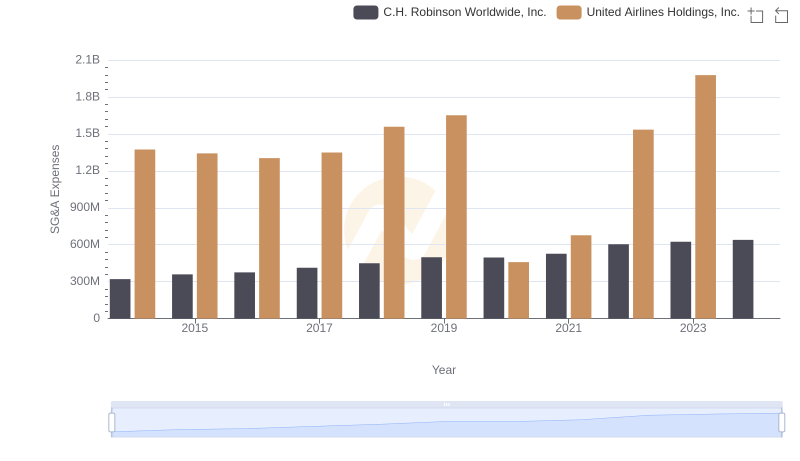
United Airlines Holdings, Inc. vs C.H. Robinson Worldwide, Inc.: SG&A Expense Trends
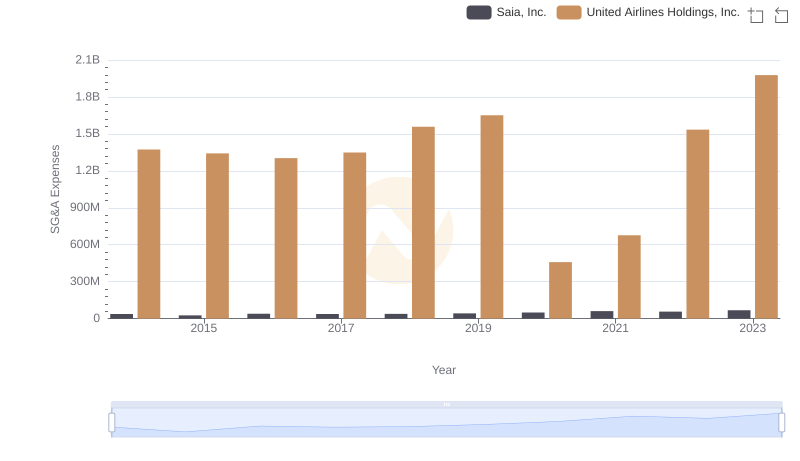
United Airlines Holdings, Inc. and Saia, Inc.: SG&A Spending Patterns Compared
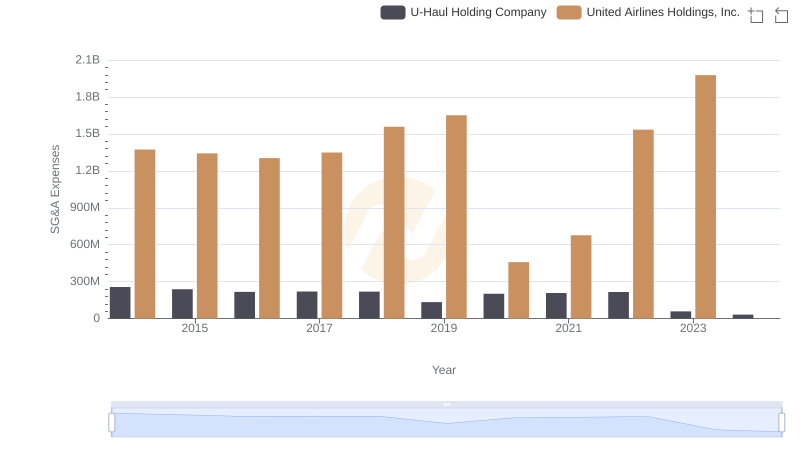
Comparing SG&A Expenses: United Airlines Holdings, Inc. vs U-Haul Holding Company Trends and Insights