| __timestamp | L3Harris Technologies, Inc. | Trane Technologies plc |
|---|---|---|
| Wednesday, January 1, 2014 | 3885000000 | 12891400000 |
| Thursday, January 1, 2015 | 5992000000 | 13300700000 |
| Friday, January 1, 2016 | 5897000000 | 13508900000 |
| Sunday, January 1, 2017 | 6168000000 | 14197600000 |
| Monday, January 1, 2018 | 6801000000 | 15668200000 |
| Tuesday, January 1, 2019 | 18526000000 | 16598900000 |
| Wednesday, January 1, 2020 | 18194000000 | 12454700000 |
| Friday, January 1, 2021 | 17814000000 | 14136400000 |
| Saturday, January 1, 2022 | 17062000000 | 15991700000 |
| Sunday, January 1, 2023 | 19419000000 | 17677600000 |
| Monday, January 1, 2024 | 21325000000 | 19838200000 |
Unleashing insights
In the ever-evolving landscape of industrial and defense sectors, Trane Technologies plc and L3Harris Technologies, Inc. have emerged as formidable players. Over the past decade, from 2014 to 2023, these companies have demonstrated significant revenue growth, reflecting their strategic prowess and market adaptability.
Trane Technologies, a leader in climate solutions, has seen its revenue grow by approximately 37% from 2014 to 2023, peaking at $17.68 billion in 2023. This growth underscores its commitment to innovation and sustainability.
Meanwhile, L3Harris Technologies, a key player in defense and aerospace, experienced a remarkable 400% increase in revenue from 2014 to 2023, reaching $19.42 billion. This surge highlights its strategic mergers and acquisitions, positioning it as a leader in the defense sector.
These trends not only reflect the companies' individual strategies but also the broader economic shifts and technological advancements shaping their industries.
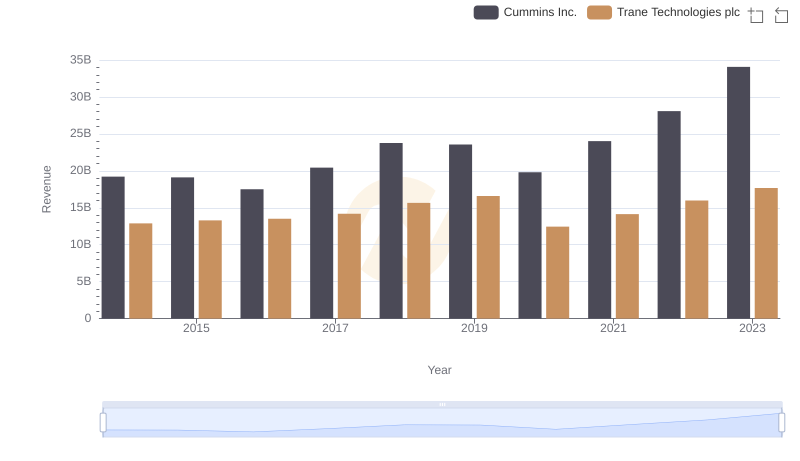
Revenue Showdown: Trane Technologies plc vs Cummins Inc.
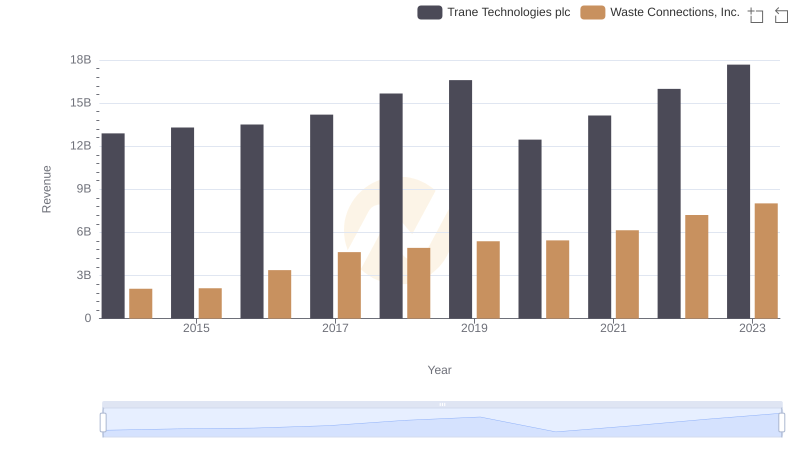
Trane Technologies plc vs Waste Connections, Inc.: Annual Revenue Growth Compared
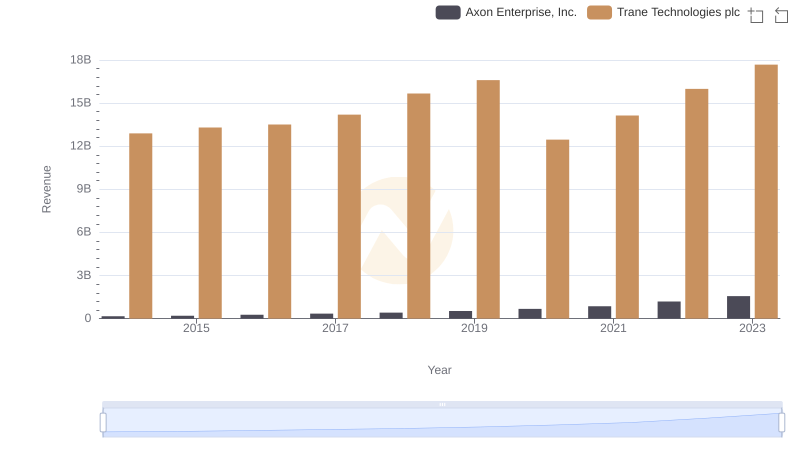
Revenue Showdown: Trane Technologies plc vs Axon Enterprise, Inc.
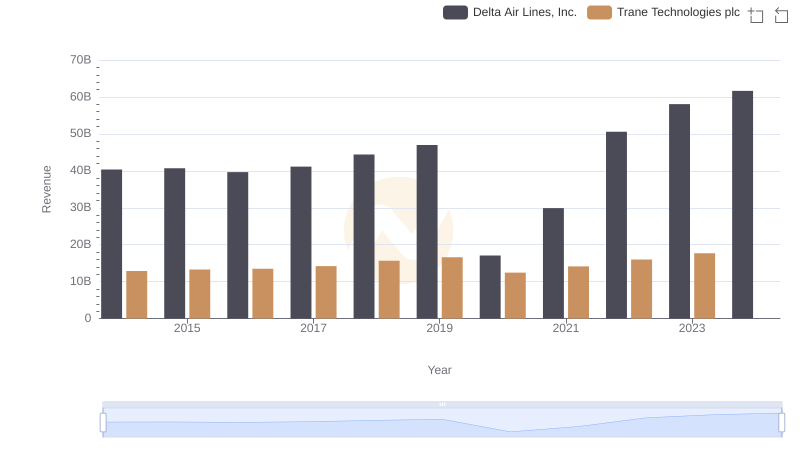
Who Generates More Revenue? Trane Technologies plc or Delta Air Lines, Inc.

Trane Technologies plc vs Fastenal Company: Annual Revenue Growth Compared
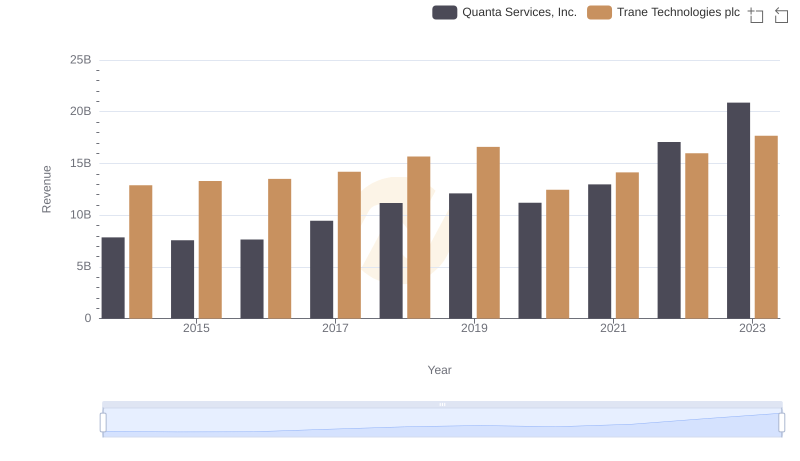
Annual Revenue Comparison: Trane Technologies plc vs Quanta Services, Inc.
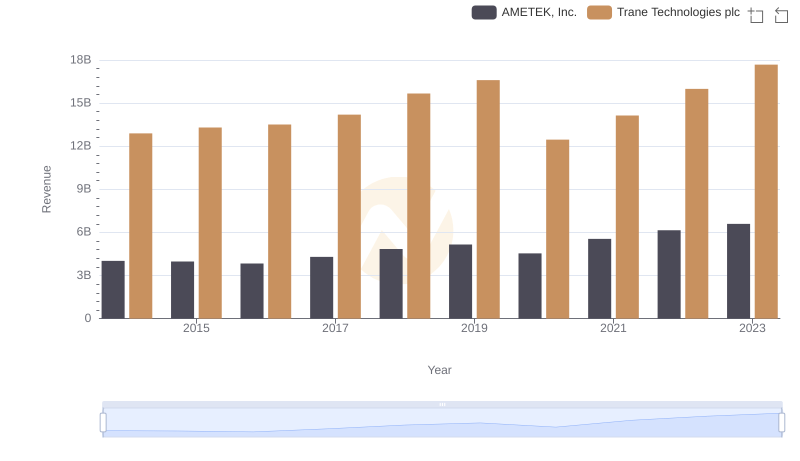
Trane Technologies plc vs AMETEK, Inc.: Annual Revenue Growth Compared
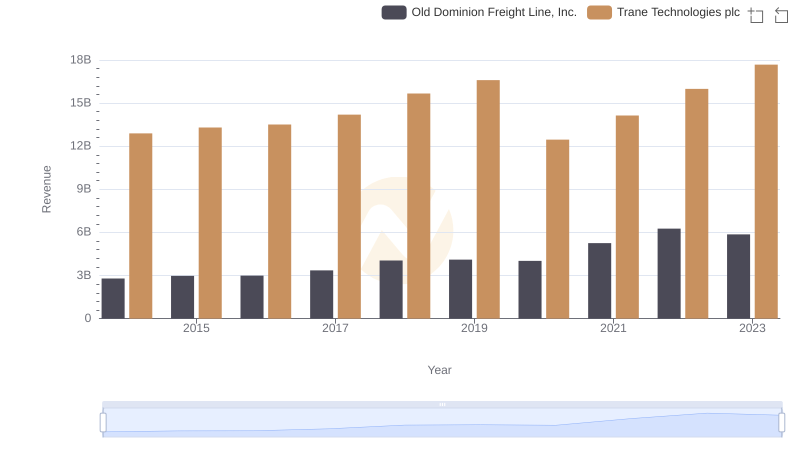
Annual Revenue Comparison: Trane Technologies plc vs Old Dominion Freight Line, Inc.
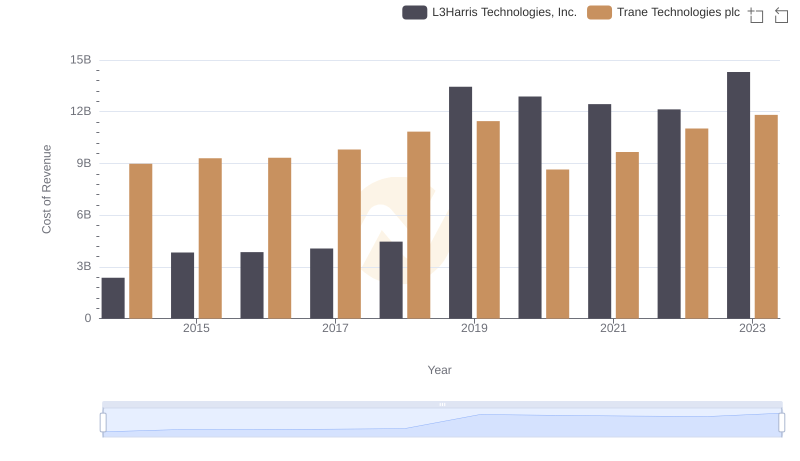
Trane Technologies plc vs L3Harris Technologies, Inc.: Efficiency in Cost of Revenue Explored
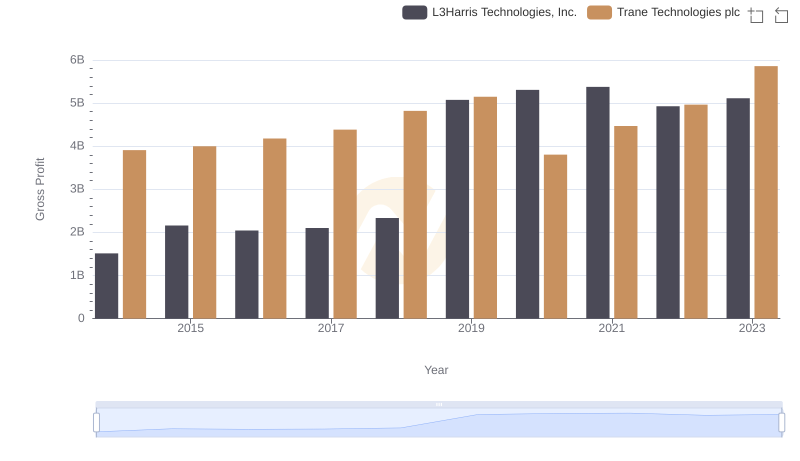
Gross Profit Comparison: Trane Technologies plc and L3Harris Technologies, Inc. Trends
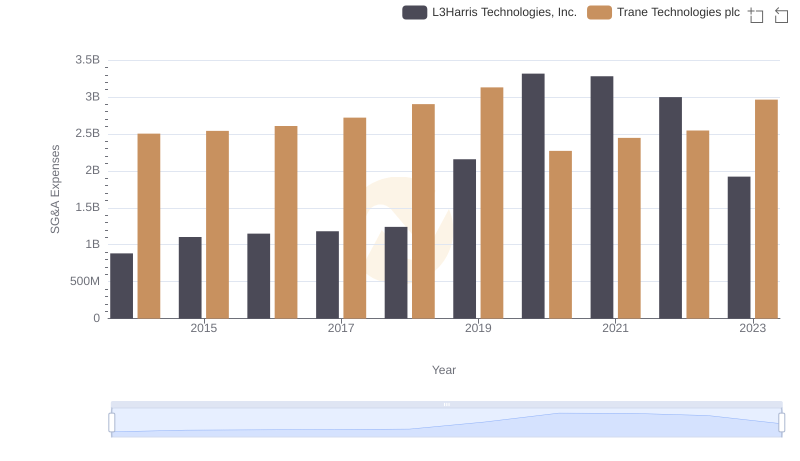
SG&A Efficiency Analysis: Comparing Trane Technologies plc and L3Harris Technologies, Inc.
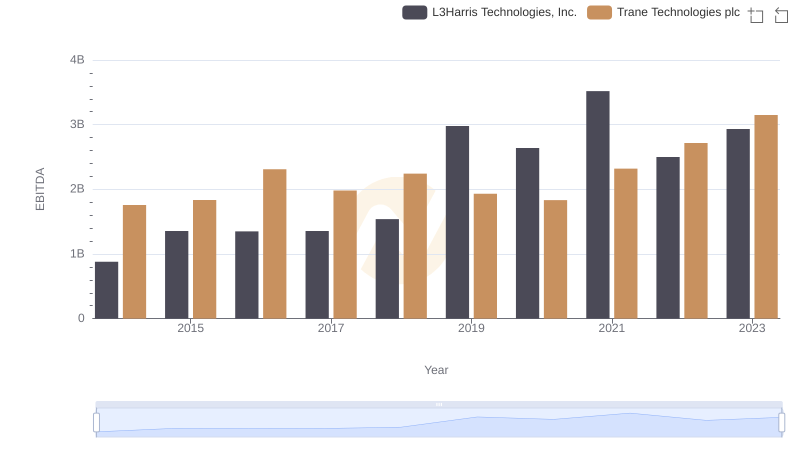
Comparative EBITDA Analysis: Trane Technologies plc vs L3Harris Technologies, Inc.