| __timestamp | L3Harris Technologies, Inc. | Trane Technologies plc |
|---|---|---|
| Wednesday, January 1, 2014 | 1515000000 | 3908600000 |
| Thursday, January 1, 2015 | 2160000000 | 3999100000 |
| Friday, January 1, 2016 | 2043000000 | 4179600000 |
| Sunday, January 1, 2017 | 2102000000 | 4386000000 |
| Monday, January 1, 2018 | 2334000000 | 4820600000 |
| Tuesday, January 1, 2019 | 5074000000 | 5147400000 |
| Wednesday, January 1, 2020 | 5308000000 | 3803400000 |
| Friday, January 1, 2021 | 5376000000 | 4469600000 |
| Saturday, January 1, 2022 | 4927000000 | 4964800000 |
| Sunday, January 1, 2023 | 5113000000 | 5857200000 |
| Monday, January 1, 2024 | 5524000000 | 7080500000 |
Data in motion
In the ever-evolving landscape of industrial giants, Trane Technologies plc and L3Harris Technologies, Inc. have showcased intriguing financial trajectories over the past decade. From 2014 to 2023, Trane Technologies consistently outperformed L3Harris in gross profit, with a notable peak in 2023, reaching approximately 5.86 billion. This marks a 50% increase from its 2014 figures. Meanwhile, L3Harris experienced a significant surge in 2019, with gross profits jumping by 118% compared to the previous year, reaching around 5.07 billion. However, by 2023, L3Harris's growth stabilized, with a gross profit of about 5.11 billion. This comparison highlights Trane's steady growth and resilience, while L3Harris's performance reflects a more volatile yet dynamic trajectory. As these companies continue to innovate, their financial narratives offer valuable insights into the industrial sector's future.
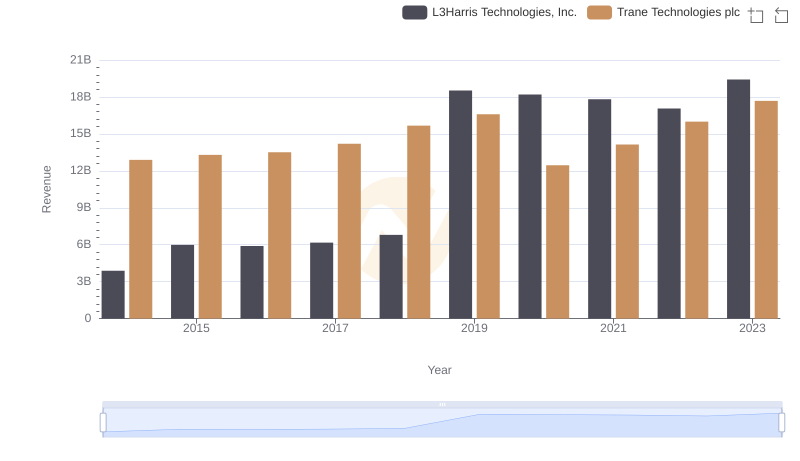
Trane Technologies plc vs L3Harris Technologies, Inc.: Examining Key Revenue Metrics
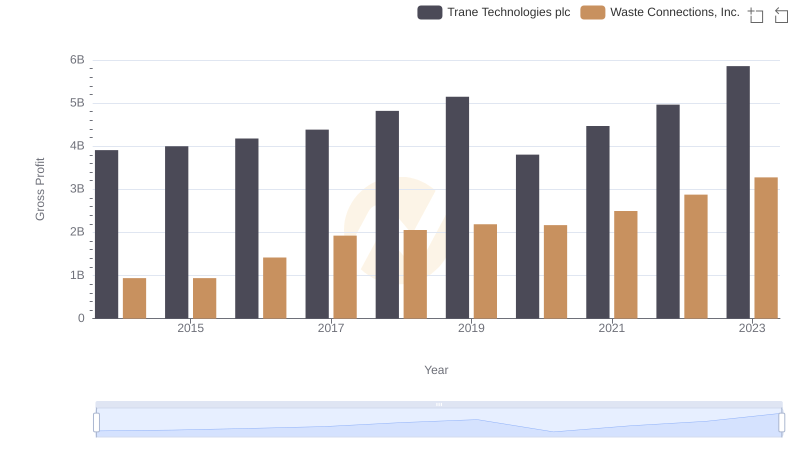
Gross Profit Comparison: Trane Technologies plc and Waste Connections, Inc. Trends
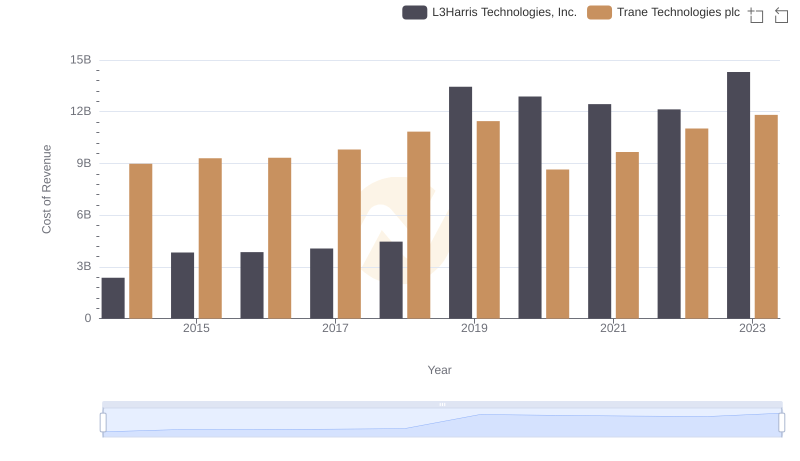
Trane Technologies plc vs L3Harris Technologies, Inc.: Efficiency in Cost of Revenue Explored
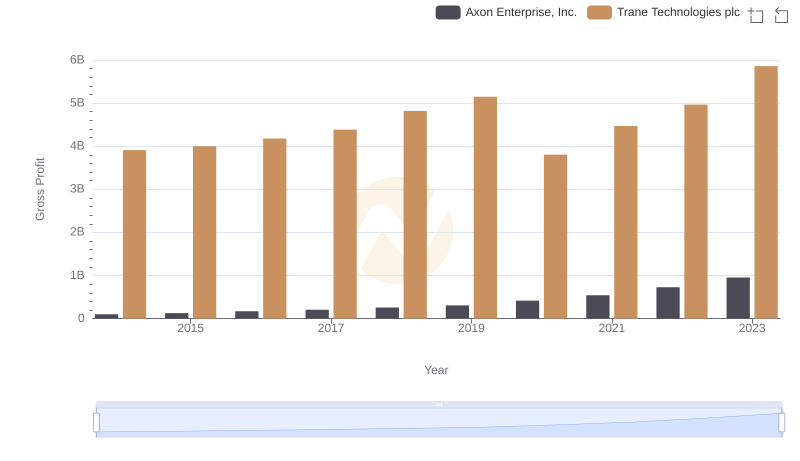
Trane Technologies plc vs Axon Enterprise, Inc.: A Gross Profit Performance Breakdown
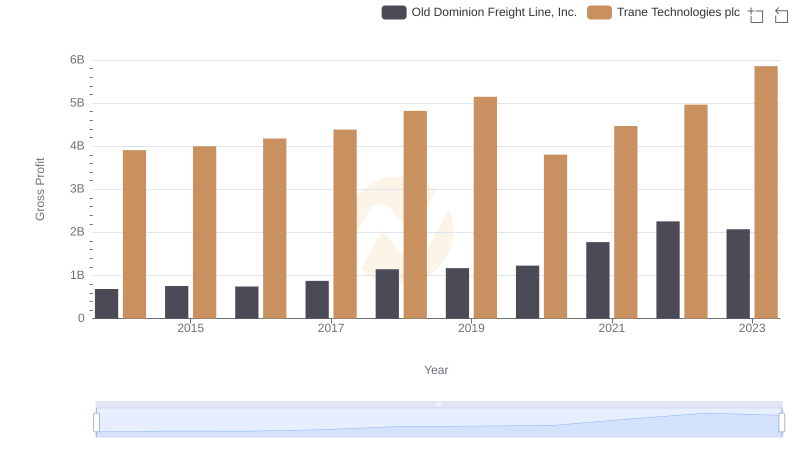
Key Insights on Gross Profit: Trane Technologies plc vs Old Dominion Freight Line, Inc.
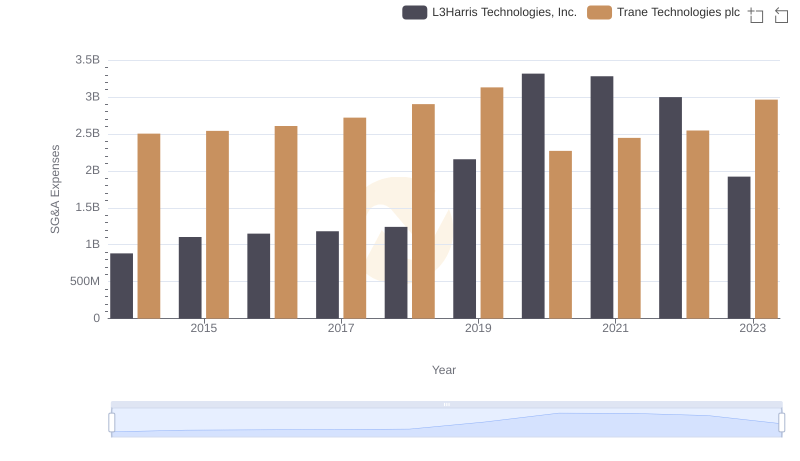
SG&A Efficiency Analysis: Comparing Trane Technologies plc and L3Harris Technologies, Inc.
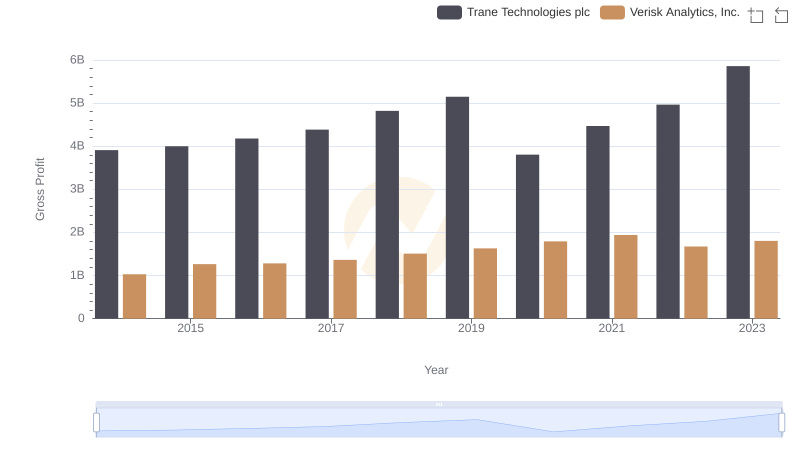
Gross Profit Trends Compared: Trane Technologies plc vs Verisk Analytics, Inc.
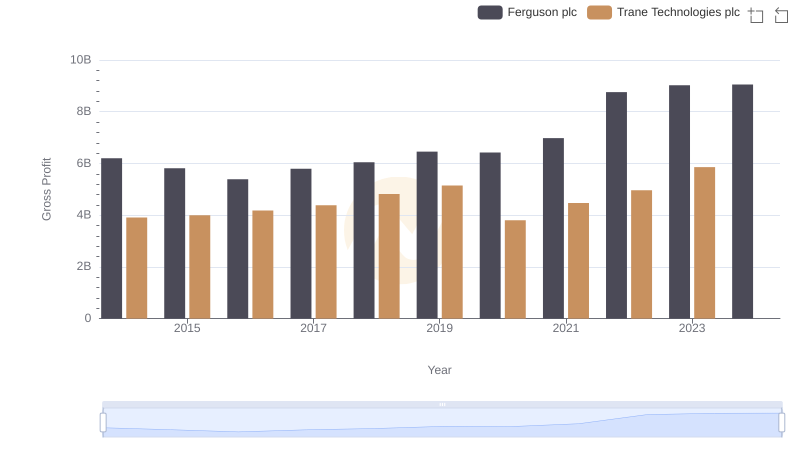
Trane Technologies plc vs Ferguson plc: A Gross Profit Performance Breakdown
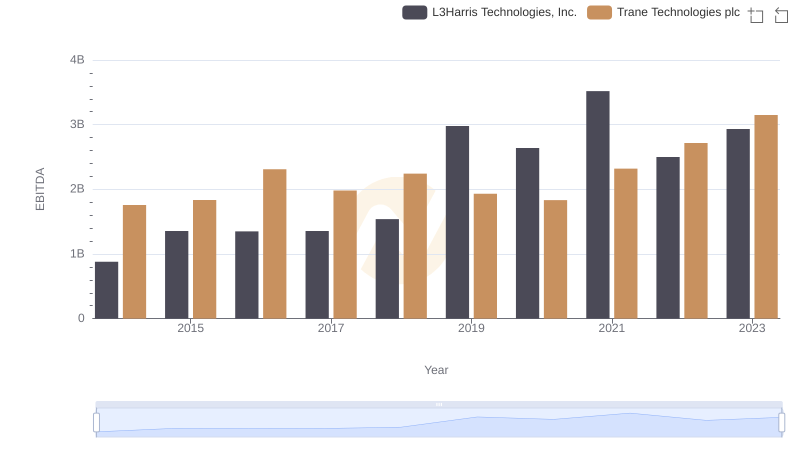
Comparative EBITDA Analysis: Trane Technologies plc vs L3Harris Technologies, Inc.